
Trusted by Companies


Provide end-to-end test suites to monitor all environments
Leverage Middleware Synthetic Monitoring for global traffic simulation, endpoint uptime measurement,
and proactive identification of user-facing issues through API monitoring and browser tests to address
availability problems before impacting customers.

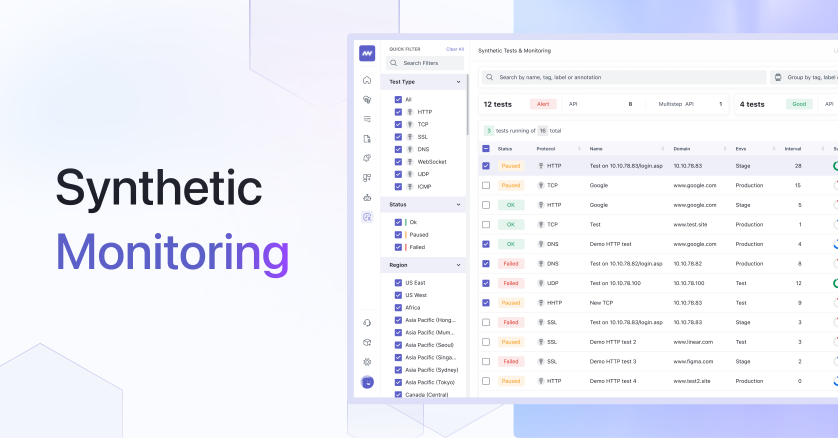
API tests for performance monitoring
- Track performance of web pages and APIs at various network levels (HTTP, SSL, DNS, TCP, Websocket, UDP, ICMP, and gRPC)
- Validate key user flows at the API level by chaining API requests in multistep tests.
- Monitoring endpoints from global locations ensures that critical applications are always available to the users.

Troubleshoot faster
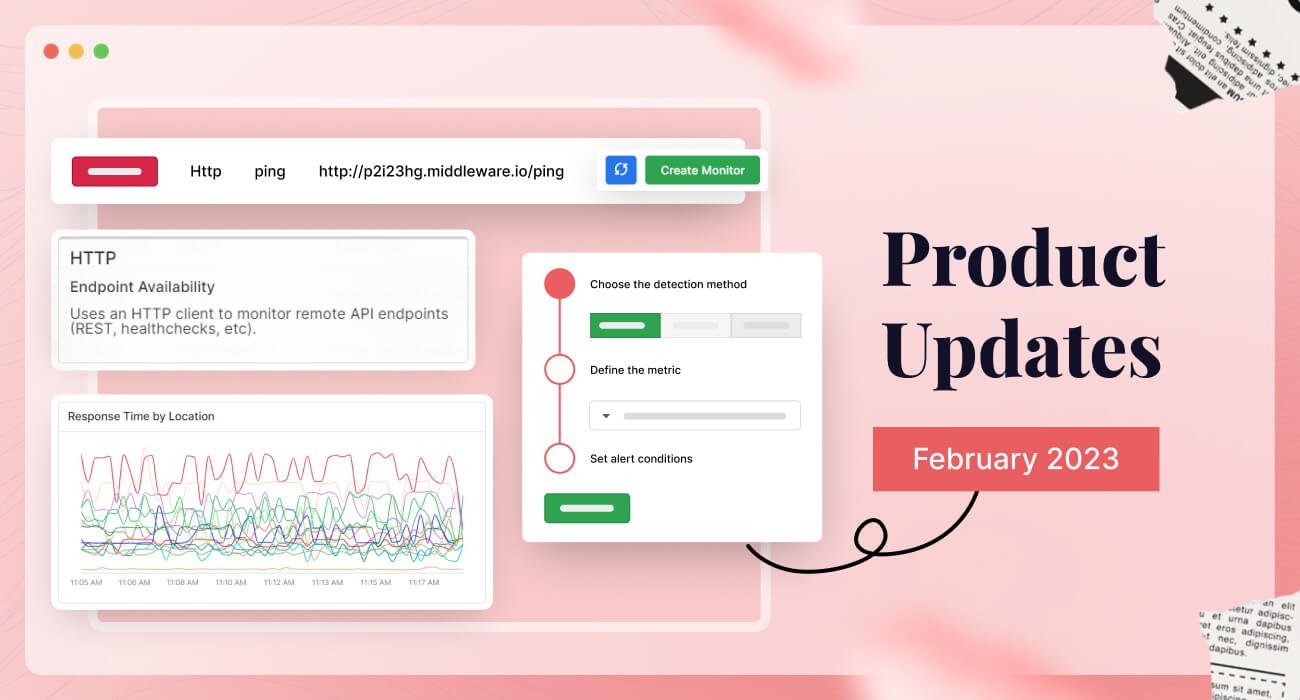
- View a breakdown of network timing data and response time by location for faster root cause analysis.
- Add assertions to validate test results.
- Analyze network timing data breakdown for quicker root cause analysis.

Reduce MTTR (mean time to resolution)
- Get full context with assertions for troubleshooting failed test runs.
- Visualize endpoint performance and uptime data alongside crucial business metrics to find issues faster.
- Monitor and maintain your SLAs by proactively tracking performance with Synthetic tests.


Resources for Synthetic Monitoring

What is Synthetic Monitoring?
Synthetic Monitoring simulates web and application end points from anywhere in the world to proactively identify and fix performance issues before they impact customers. You can read more about system monitoring here
What types of protocols are supported by Middleware's Synthetic Monitoring?
Middleware’s Synthetic Monitoring supports multiple protocols, including HTTP, SSL, DNS, TCP, Websocket, UDP, ICMP, and gRPC.
How does Multi-Step API Monitoring work?
Multi-Step API Monitoring allows you to simulate authentication and complex API workflows by using the response from a previous step as input for following steps.
Can I monitor my application's performance from global locations?
Yes, Middleware’s Synthetic Monitoring allows you to monitor your environment from global locations for comprehensive coverage, ensuring critical applications are always available to users.
How can I visualize application performance and uptime data?
Middleware’s Synthetic Monitoring allows you to visualize application performance and uptime data alongside key business metrics, providing complete visibility into application performance and uptime.