
Trusted by Companies


Deploy on any stack at any scale
Gain full visibility into your cloud-native infrastructure with end-to-end distributed
tracing, dependency mapping, and full-stack application performance monitoring.

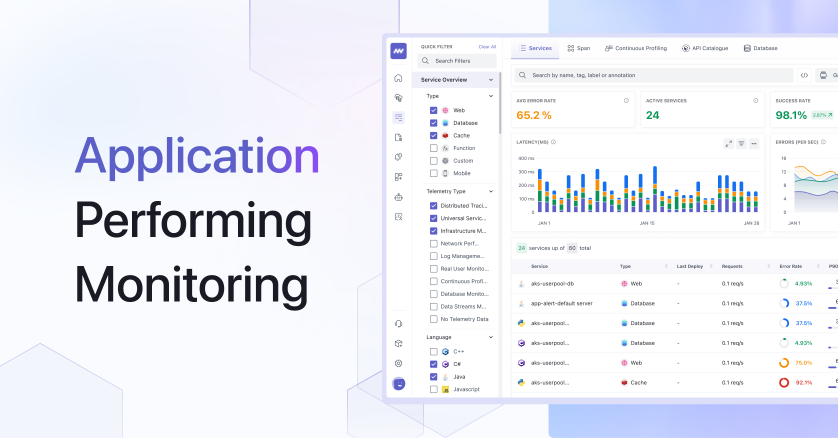
Identify, optimize, and fix Issues on
a single platform
Middleware APM allows you to monitor service dependencies and health metrics, reduce latency, and
eliminate errors by seamlessly correlating distributed traces with frontend and backend data.

End-to-End tracing
- Spot and resolve issues even faster by collecting end-to-end distributed traces and correlating them with the rest of your observability data
- Connect distributed traces to infrastructure metrics, logs, and processes
- Deploy APM in seconds on hosts and containers, and easily instrument your application to generate traces.

Dependency Visualization
& Profiling
- With a breakdown of application profiling data for each distributed request, you can quickly identify the most time-consuming parts of your code.
- Discover components whose communication contains errors.
- Analyze code bottlenecks that impact service performance and other typical issues like slow database queries, and unusual memory consumption with profiling.

Service health
monitoring
- Real-time metrics and correlated telemetry provide instant visibility into the health of every service and deployment.
- Detect issues in any service using visualizations and alerting across all services.
- Service maps generated by APM provide immediate visibility into all service interactions, dependencies, and performance.

Instant root cause
analysis and Error trace
- Middleware AI analyses billions of events and traces to assist you in addressing the causes of problems rather than the symptoms.
- The Error Tracking Explorer displays issues that Middleware has identified as well as important aggregates such as each issue’s total error count and frequency over time.
- Get error details and each attribute which helps to identify the root cause and solution


What is Application Performance Monitoring?
Application Performance Monitoring (APM) is a tool that helps you troubleshoot issues in real-time, optimize performance, improve user experience, and reduce downtime for your application.
Can I monitor all services running inside my application in one place?
Yes, with Middleware’s APM, you can monitor all services running inside your application in one place, including viewing important service performance metrics like request rate, error rate, and latency.
How does Middleware's APM help with error detection and analysis?
Middleware’s APM helps identify root causes by pinpointing the exact data causing issues, and provides an Error Tracking Explorer to view issues, aggregates, and error frequency over time.
Is Middleware's APM easy to deploy and integrate with my existing tech stack?
Middleware’s APM offers easy deployment on hosts and containers in seconds, and predefined integrations with leading tech stacks like Java, Go, Python, Node, and Cloudflare Worker.
Can I visualize service health and detect issues in real-time?
Yes, Middleware’s APM provides real-time metrics and correlated telemetry for instant visibility into the health of every service and deployment, enabling you to detect issues in any service using visualizations and alerting across all services.