
Summary: Application logs are timestamped records of everything that happens inside a running software system: errors, user events, performance signals, and security activity. Without them, debugging a production incident means guessing in the dark. This guide covers what application logs are, the 8 types every developer should know, the 6 most common management challenges, best practices, and how Middleware helps teams get full log visibility.
TL;DR
- Application logs record runtime events including errors, user actions, performance metrics, and security activity in timestamped entries.
- There are 8 core log types: access, authentication, authorization, error, change, availability, transaction, and debug logs.
- The biggest challenges are log fragmentation, unstructured formats, inconsistent log levels, sensitive data exposure, storage overhead, and lack of real-time visibility.
- Best practices: centralize logs, use structured JSON format, apply consistent log levels, add correlation IDs, mask sensitive fields, and define retention policies.
- Logs are most powerful when correlated with metrics and traces, not analyzed in isolation.
- Middleware provides AI-powered anomaly detection, real-time dashboards, 6 months of historical log search, and OpsAI to automatically detect and resolve issues before users are affected.
What are application logs?
Application logs are timestamped, structured records generated by a software application during runtime. They capture events such as errors, user actions, system state changes, and performance measurements, giving developers a chronological trace of everything that happened inside the application.
Think of them as a flight data recorder for your software. When something goes wrong, a page crashes, a transaction fails, a service goes down, the logs tell you exactly what happened, in what order, and why.
A single log entry typically records:
- Timestamp — when the event occurred
- Log level — severity (INFO, WARN, ERROR, etc.)
- Event description — what happened
- Context metadata — user ID, request ID, service name, stack trace
Without structured, reliable logs, engineers are left diagnosing production incidents from memory or user reports, neither of which scales.
Related: New to observability? What is log monitoring? →
Why do application logs matter?
Logs are the lowest-level observability signal you have. Unlike metrics (which tell you what is wrong) or traces (which show you where a request traveled), logs tell you why something failed, with the full context of the event.
| Observability signal | What it answers | When to use |
|---|---|---|
| Metrics | What is happening right now? (CPU, latency, error rate) | Dashboards, alerting thresholds |
| Traces | Which services were involved in this request? | Distributed system debugging |
| Logs | Why did this specific event occur? | Root cause analysis, auditing, security |
Logs matter most in five practical scenarios: debugging failures, monitoring performance, detecting security incidents, satisfying compliance requirements, and catching early warning signals before users notice problems.
What are the 8 types of application logs?
Not all logs serve the same purpose. Using the right log type for the right context makes both collection and analysis significantly more efficient.
Access logs
Record every inbound request including IP addresses, HTTP methods, endpoint paths, and response status codes. Essential for monitoring traffic patterns and detecting unauthorized access attempts.
Real-world scenario: A financial app detects multiple login attempts from geographically dispersed IPs within 5 minutes. Access logs flag the pattern, triggering an automated credential-stuffing alert before account lockouts begin.
INFO  2026-05-29 10:10:05.123  User 'user_sam' login attempt from IP: 192.168.1.1
INFO  2026-05-29 10:10:10.234  User 'user_sam' login attempt from IP: 172.16.4.2
INFO  2026-05-29 10:10:15.456  User 'user_sam' login attempt from IP: 10.0.0.3
WARN  2026-05-29 10:10:20.678  Multiple login attempts for 'user_sam' across 3 IPs in 15s
ERROR 2026-05-29 10:10:30.789  Credential stuffing attack detected, security alert triggered
Authentication logs
Capture login attempts (both successful and failed), timestamps, and source IPs. Essential for detecting brute-force attacks, credential stuffing, and account takeover attempts.
Real-world scenario: A cloud service detects repeated failed logins from an unfamiliar geographic location. Security teams enforce multi-factor authentication to block unauthorized access before any account is compromised.
Authorization logs
Track permission changes, privilege escalations, and access denials. Critical for catching security misconfigurations and ensuring compliance with access-control policies.
Real-world scenario: A user unexpectedly gains admin rights after a misconfigured deployment script. Authorization logs surface the unexpected role change within seconds, enabling IT to roll back before any data is accessed.
ERROR 2026-05-29 16:05:12.654  Unexpected permission change, 'sam_suthar' granted admin rights
INFO  2026-05-29 16:05:15.123  Role changed: 'sam_suthar' User to Admin
ERROR 2026-05-29 16:05:18.789  Stack trace: at UserService.updatePermissions(UserService.java:142)
INFO  2026-05-29 16:06:00.987  Rollback initiated, reverting 'sam_suthar' to 'User'
INFO  2026-05-29 16:06:15.432  Permission rollback completed successfully
Error logs
Store failures, exceptions, and stack traces. This is the first place developers look when something breaks in production.
Real-world scenario: A payment gateway starts failing for a subset of users. Error logs immediately surface an Invalid Response Format exception tied to a breaking API change in the latest deployment, letting developers revert quickly.
ERROR 2026-05-29 15:22:05.987  PaymentGateway API Error, Invalid Response Format
ERROR 2026-05-29 15:22:06.123  Stack trace: at PaymentGatewayService.processPayment(...)
ERROR 2026-05-29 15:22:06.456  Request ID: 75b4d6a3-e0c7-4c2b-a263-438d5b36ff9f
Change logs
Document deployments, configuration updates, and schema migrations. Invaluable for diagnosing post-release regressions where the root cause is something changed.
Real-world scenario: A new release slows down page load times noticeably. Change logs pinpoint a missing caching optimization introduced in the latest deployment, guiding the rollback decision.
Availability logs
Track uptime, health-check results, and service recovery times. Used to measure SLA compliance and mean time to recovery (MTTR).
Real-world scenario: A streaming platform buffers frequently during peak hours. Availability logs show high server load and repeated health-check failures, prompting engineers to scale infrastructure proactively.
INFO  2026-05-29 14:45:11.123  Service 'PaymentGateway' is UP
INFO  2026-05-29 14:45:11.456  Service 'PaymentGateway' is DOWN
WARN  2026-05-29 14:45:11.789  Service 'PaymentGateway' restored after 5 minutes of downtime
Transaction logs
Record business-critical operations such as payments, orders, and data transfers, with full audit trails. These differ from error logs because they capture both successful and failed business events.
Real-world scenario: A refund is processed twice due to a network retry. Transaction logs show the duplicate event with matching request IDs, enabling the engineering team to implement idempotency checks.
Debug logs
Verbose, low-level detail used primarily in development: loop iterations, variable values, internal function calls. Should be disabled or sampled in production to avoid flooding storage and reducing signal clarity.
Related: Log levels explained: a developer’s reference guide →
Log levels explained
Log levels categorize the severity of an event. Using them consistently is what separates useful logs from log noise. Every major logging framework including Log4j, Winston, Python logging, and Zerolog follows the same core hierarchy.
| Level | When to use | Use in production? |
|---|---|---|
| TRACE | Extremely granular step-by-step flow, loop iterations, variable values | Disable |
| DEBUG | Developer context for diagnosing specific behavior | Sample only |
| INFO | Normal operational milestones: service started, user logged in | Yes |
| WARN | Unexpected but recoverable conditions: retry attempts, approaching limits | Yes |
| ERROR | Failures requiring attention: exceptions, failed requests, timeouts | Always |
| FATAL / CRITICAL | System-level failures requiring immediate action: crash, data loss risk | Always |
Practical rule: In development, enable DEBUG and above. In production, log INFO and above. If actively investigating an incident, scoped DEBUG sampling is acceptable.
6 common application log management challenges
Collecting logs is the easy part. Managing them at scale while keeping them useful, searchable, and secure is where most teams struggle.
Log fragmentation across systems
In microservices and cloud-native environments, logs scatter across dozens of services, containers, and cloud providers. Without a centralized view, correlating a single user request across multiple services means switching between consoles and almost certainly losing context along the way.
Unstructured log formats
Plain-text logs without consistent field names make automation nearly impossible. You cannot reliably query or alert on logs if each service formats timestamps, error codes, and user IDs differently. Structured JSON solves this but requires discipline across every team and service from the start.
No consistent log levels or filtering
When everything is logged as INFO or DEBUG, critical errors drown in routine output. Alerts misfire. On-call engineers waste time triaging noise instead of addressing real incidents. Consistent log levels are a discipline problem before they are a tooling problem.
Sensitive data exposure in logs
Logs frequently capture more than intended: API tokens, session cookies, PII, and payment details. Exposed log data is a direct path to GDPR and HIPAA violations. Sensitive fields must be masked or redacted at the source, before they ever reach storage or a logging platform.
Storage and cost overhead
High-traffic applications generate large volumes of log data daily. Without tiered retention policies, storage costs spiral and query performance degrades. Teams often keep everything indefinitely and discover later they are paying to store debug logs from years ago.
Batch analysis instead of real-time visibility
Many teams still process logs in batch pipelines that introduce delays of several minutes or more. In modern systems, that latency means outages go undetected until users are already affected. Real-time log streaming and alerting are now a baseline expectation, not a luxury.
Related: Log formatting best practices →
Best practices for application logging
Good logging is about making data extractable and actionable, not just collecting it. These practices apply regardless of your stack or team size.
Use structured, machine-readable formats (JSON)
JSON logs give every field a consistent name and type, making them instantly queryable by any log management tool. Fields like timestamp, level, service, request_id, and user_id should be present in every log line. Human-readable plaintext may feel natural to write; JSON is what your tools and your future self during an incident actually need.
Centralize logs across all services
A centralized log aggregation platform eliminates the “which dashboard do I check?” problem during incidents. It also enables cross-service correlation: you can trace a failed request through the API gateway, microservice, and database in a single query.
Apply log levels consistently and purposefully
Treat log levels as a contract, not a suggestion. ERROR means someone needs to look at this. WARN means this is unusual but not broken. INFO means normal operation confirmed. If production dashboards are flooded with DEBUG entries, the problem is misconfiguration.
Add correlation IDs to every request
A unique request_id or trace_id passed through every service log makes debugging distributed failures dramatically faster. Instead of grepping for patterns, you filter by ID and get the entire request’s story across services in chronological order. This is typically a small one-time change at the API gateway level.
Mask or redact sensitive data at the source
Never rely on post-ingestion scrubbing to protect PII, tokens, or credentials. Redaction must happen in the application itself before the log event is written. Audit logging code with the same rigor applied to SQL queries.
Set tiered retention policies
Not all logs need the same lifespan. A practical baseline:
- Debug logs: 7 days
- Operational INFO/WARN logs: 30 to 90 days
- Error logs: 90 days
- Security and audit logs: 12 to 24 months (longer for HIPAA, PCI-DSS, or SOC 2 environments)
Use tiered storage, hot for recent data and cold or archive for older data, to manage costs without losing compliance coverage.
Real-world use cases for application logs
Application logs are useful well beyond incident response. Here is how engineering teams use them across the full software lifecycle.
Debugging failed API requests Trace the full lifecycle of a failed request from input validation through service hops and database queries to pinpoint exactly where it broke and why. Logs with correlation IDs make this a minutes-long task rather than an hours-long investigation.
Detecting security incidents Authentication logs reveal credential stuffing attacks, brute-force attempts, and unusual access patterns, often well before they escalate. Combined with anomaly detection, this can be fully automated.
Identifying performance bottlenecks Slow database queries, high-latency external API calls, and memory pressure all leave traces in logs. Correlate them with APM data for root-cause clarity.
Compliance and audit trails Audit logs provide the evidence trail required for GDPR, HIPAA, SOC 2, and PCI-DSS, recording who accessed what and when with full context.
Proactive incident prevention Rising error rates, increasing retry counts, and memory creep are all visible in logs before they cause user-facing failures. Log-based alerting is often the earliest warning signal available. With OpsAI, this step becomes automated: rather than waiting for an alert to page someone, OpsAI detects the pattern and begins remediation on its own.
Post-mortem and root cause analysis A detailed log record lets you reconstruct the exact sequence of events during an outage. This is invaluable for writing accurate post-mortems and preventing recurrence.
Monitoring application logs with Middleware
Middleware’s log monitoring platform is built for distributed, cloud-native environments. It collects logs from every layer of your stack including servers, containers, cloud services, and application code, and surfaces them in a unified interface alongside metrics and traces.
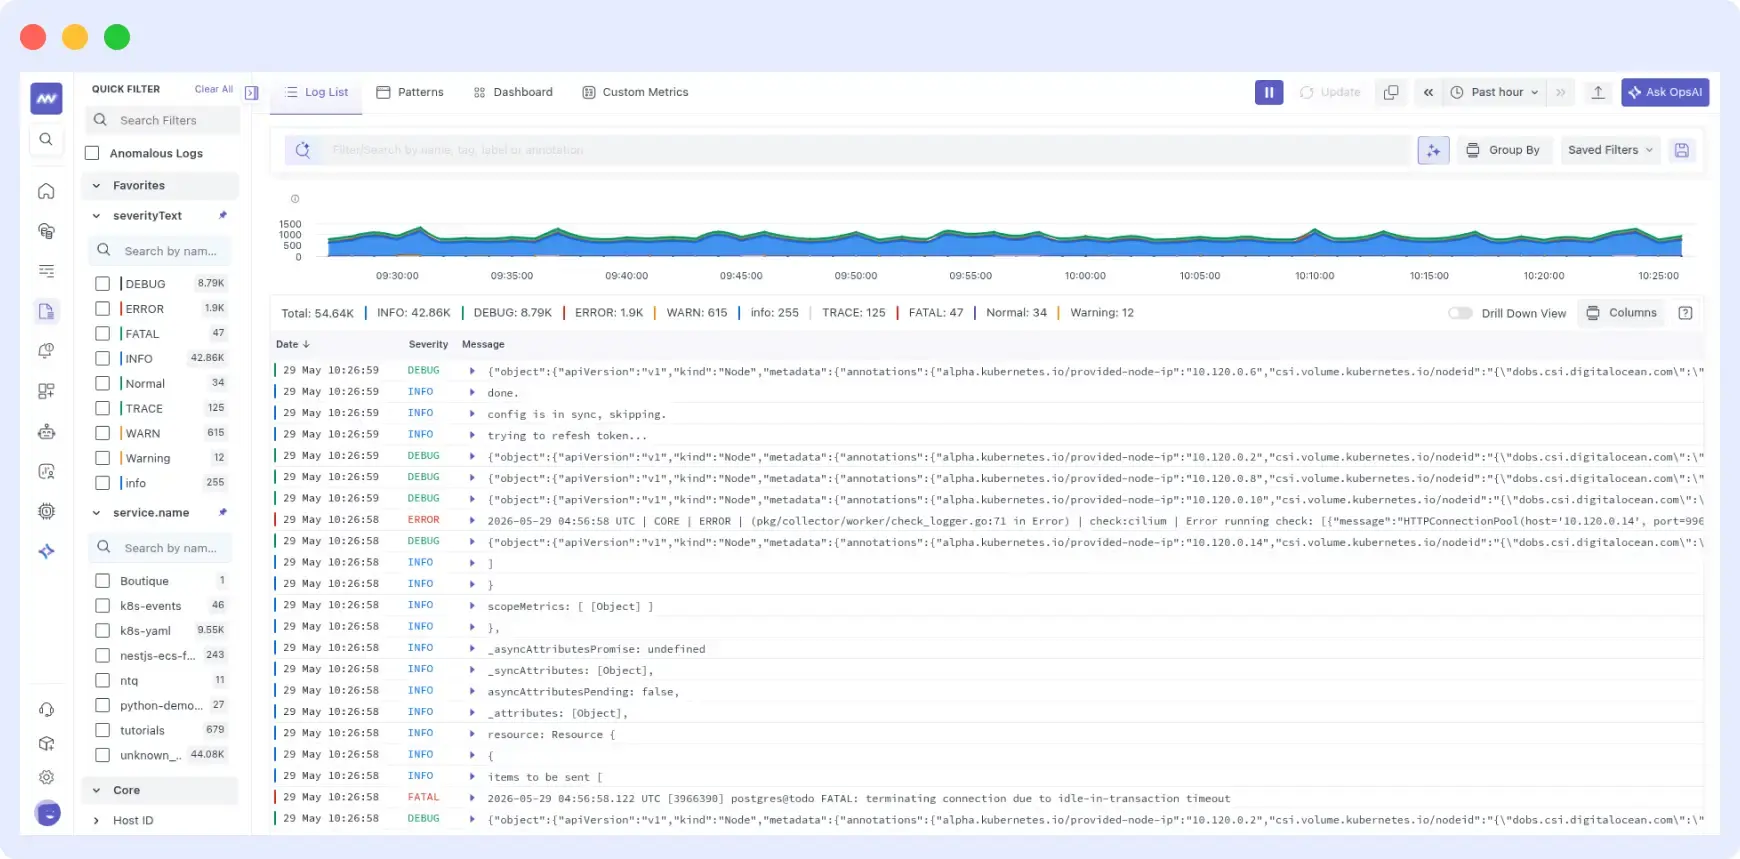
Key capabilities:
- Centralized log aggregation — Collect from servers, containers, Kubernetes, and cloud services into one searchable interface, eliminating dashboard-switching during incidents.
- Real-time monitoring — Live log streaming with customizable dashboards. See errors the moment they happen, not minutes later via a batch pipeline.
- Advanced search and filtering — Keyword, regex, and operator-based queries with autocomplete. Find exact log entries across large data volumes in seconds.
- AI-powered anomaly detection — Automatically surface unusual patterns and outliers. Get root-cause recommendations without manually reviewing thousands of log lines.
- Log-metric-trace correlation — Connect log events directly to APM traces and infrastructure metrics to understand the full system context around any failure.
- Historical search — Investigate incidents from months ago without exporting to external storage. Essential for compliance reviews and trend analysis.
- Custom alerts — Set threshold-based or pattern-based alerts on any log field to get notified before issues reach users.
From log insight to auto-remediation with OpsAI
Spotting an issue in your logs is only half the work. Acting on it quickly is where most teams lose time.
Middleware’s OpsAI SRE agent connects directly to your log data and goes beyond alerting. It detects anomalies, identifies the root cause across logs, metrics, and traces, and can automatically trigger remediation actions before your on-call engineer even gets paged.
For teams managing complex distributed systems, this closes the gap between log visibility and actual incident resolution. Instead of a developer manually reading through log entries at 2 AM, OpsAI surfaces the likely cause and recommends or executes the fix.
What OpsAI does in practice:
- Monitors log patterns continuously for signs of degradation or failure
- Correlates log anomalies with metrics and traces to identify root cause
- Suggests or automatically applies fixes based on predefined runbooks
- Reduces MTTR by cutting out the manual investigation step
Related: See how OpsAI works →
Since implementing Middleware, we have witnessed a substantial enhancement in system performance, marked by a reduction of downtime incidents by half and a nearly 50% decrease in mean time to resolve (MTTR). This significant improvement has enabled us to deliver a more stable and reliable experience for our users.
Krishna Charan BS, Information Security Head, MindOrigin
Getting started: installing the Middleware agent
Installing the agent takes under two minutes and automatically starts collecting from /var/log:
MW_API_KEY=your_api_key_here \
MW_TARGET=https://your-account.middleware.io:443 \
bash -c "$(curl -L https://install.middleware.io/scripts/deb-install.sh)"
Middleware gives you real-time log monitoring, AI-powered anomaly detection, full trace correlation, and OpsAI to automatically detect and resolve issues before users are affected. No credit card required.
See Middleware log monitoring →
What are application logs?
Application logs are structured, timestamped records generated by a running software application. They capture events such as errors, user actions, system state changes, and performance metrics, giving developers a chronological record of everything that happened. They are the primary tool for debugging, performance optimization, security monitoring, and compliance auditing.
What are the main types of application logs?
The eight main types are access logs (inbound requests), authentication logs (login attempts), authorization logs (permission changes), error logs (failures and exceptions), change logs (deployments and config changes), availability logs (uptime and health checks), transaction logs (business-critical operations), and debug logs (verbose development diagnostics).
What should every log entry include?
Every log entry should include a precise timestamp in ISO 8601 format, a log level, a clear event description, a correlation or request ID, the service or component name, and relevant context metadata such as user ID, endpoint, and stack trace for errors. Never log sensitive fields like passwords, tokens, or PII without masking.
How long should application logs be retained?
A general baseline: debug logs for 7 days, operational INFO/WARN logs for 30 to 90 days, error logs for 90 days, and security and audit logs for 12 to 24 months. Retention periods should be longer for environments subject to HIPAA, PCI-DSS, or SOC 2. Use tiered storage to manage costs without losing compliance coverage.
How do application logs help with security?
Authentication logs detect brute-force and credential-stuffing attacks. Authorization logs surface unexpected privilege escalations. Access logs reveal unusual traffic patterns. When paired with anomaly detection, logs can automatically alert on suspicious behavior before any user impact occurs. They also provide the forensic trail needed for breach notifications and regulatory audits.
What tools are commonly used for managing and analyzing application logs?
Middleware, Datadog, Dynatrace, ELK Stack, Fluentd, and Grafana.