Category: Knowledge
-
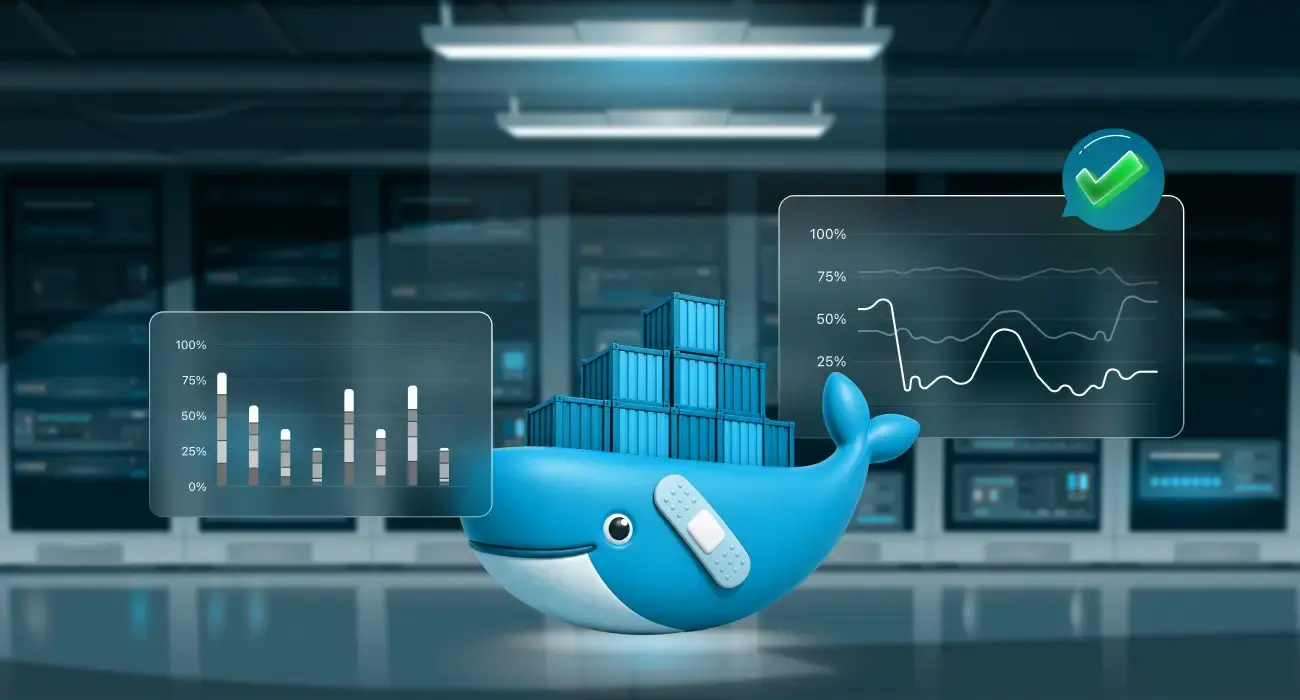
Docker Status: How to Check If Docker Is Down and Fix Common Errors
Docker status isn’t one thing. When a container looks off, you’re never sure whether to check the daemon, the container itself, or the app running inside it, and there’s no single docker status command that just tells you. This guide gives you the exact command for each of the three status types, so you can find what’s…
-
How AI-driven alerts caught a memory leak before it became an outage
A memory leak was growing quietly in production, invisible to threshold-based monitoring. Within hours of deploying the middleware, the team behind it received an AI-driven alert that flagged the anomaly before it could cascade into a full outage. TL;DR A memory leak grew silently in production until an AI-driven alert flagged the anomaly hours before pods would…
-
Kubernetes CrashLoopBackOff: Causes, Diagnosis, and Fixes
Summary: CrashLoopBackOff is one of the most common and most frustrating Kubernetes errors engineers face in production. It means a container keeps crashing and restarting in a loop, but the error actually causing it is hidden inside logs and exit codes that most guides gloss over. This article covers every root cause in depth, gives…
-
What Is Kubernetes ImagePullBackOff Error and How to Fix It
Summary: ImagePullBackOff is a Kubernetes pod status that prevents your application from starting before it can pull the image. The container image can’t be pulled from the registry, so nothing runs. It’s one of the first errors engineers hit when deploying to Kubernetes, and while the fix is almost always straightforward once you know the…
-
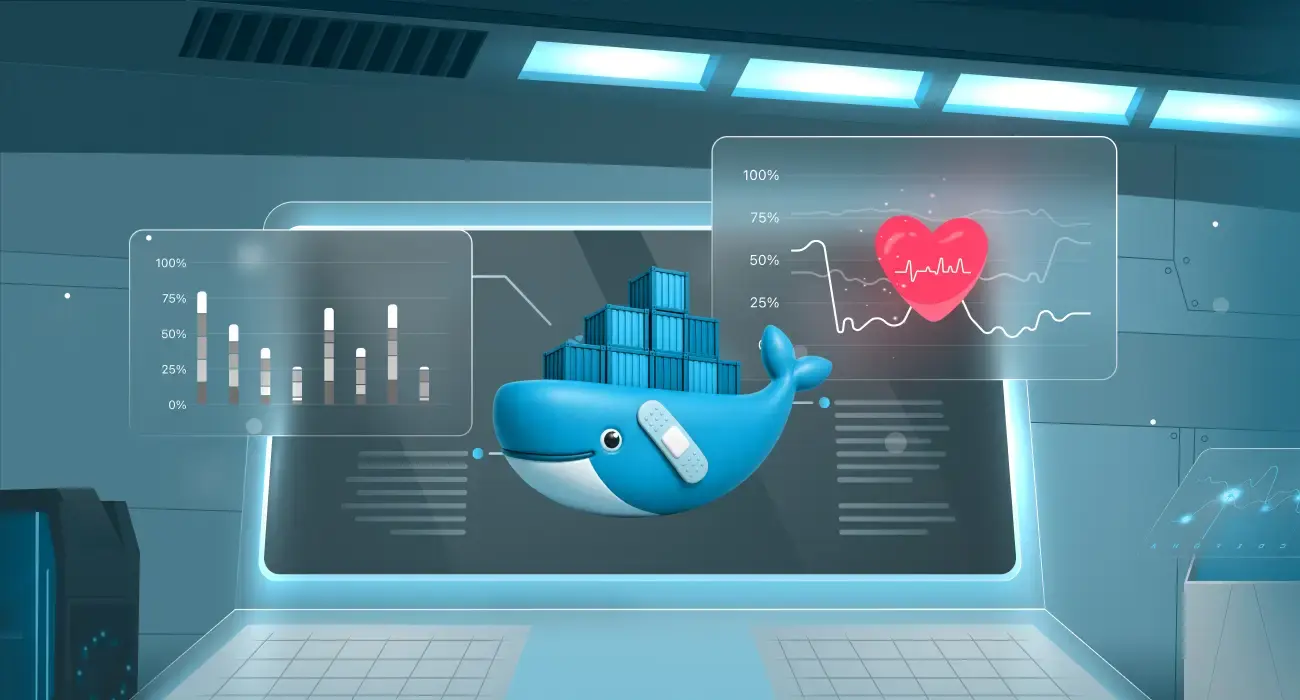
Docker Health Checks: How to Monitor, Configure, and Troubleshoot Container Health
Docker health checks are used to determine if an application running inside a container is actually functioning correctly and not just if the container process is running. A container can appear “up” while its application is unresponsive, misconfigured, or unable to reach required dependencies. Health checks solve this gap by actively validating real application behavior.…
-
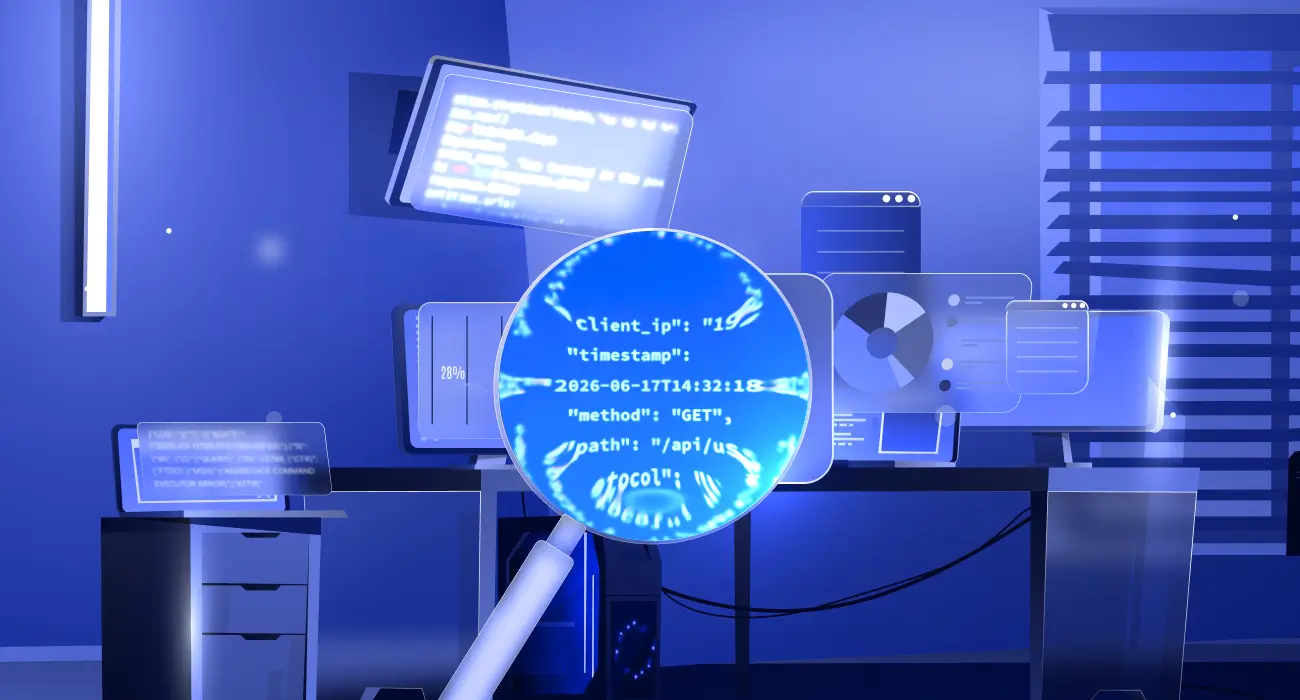
What is Log Parsing? Techniques and Best Practices
Summary: Log parsing is the process of converting raw log entries into structured fields that can be searched, filtered, and analyzed. Teams use techniques such as regex, Grok patterns, and JSON parsing to extract data from different log formats. Parsing can happen at different stages of the pipeline, including the application, collector, ingest layer, or…
-
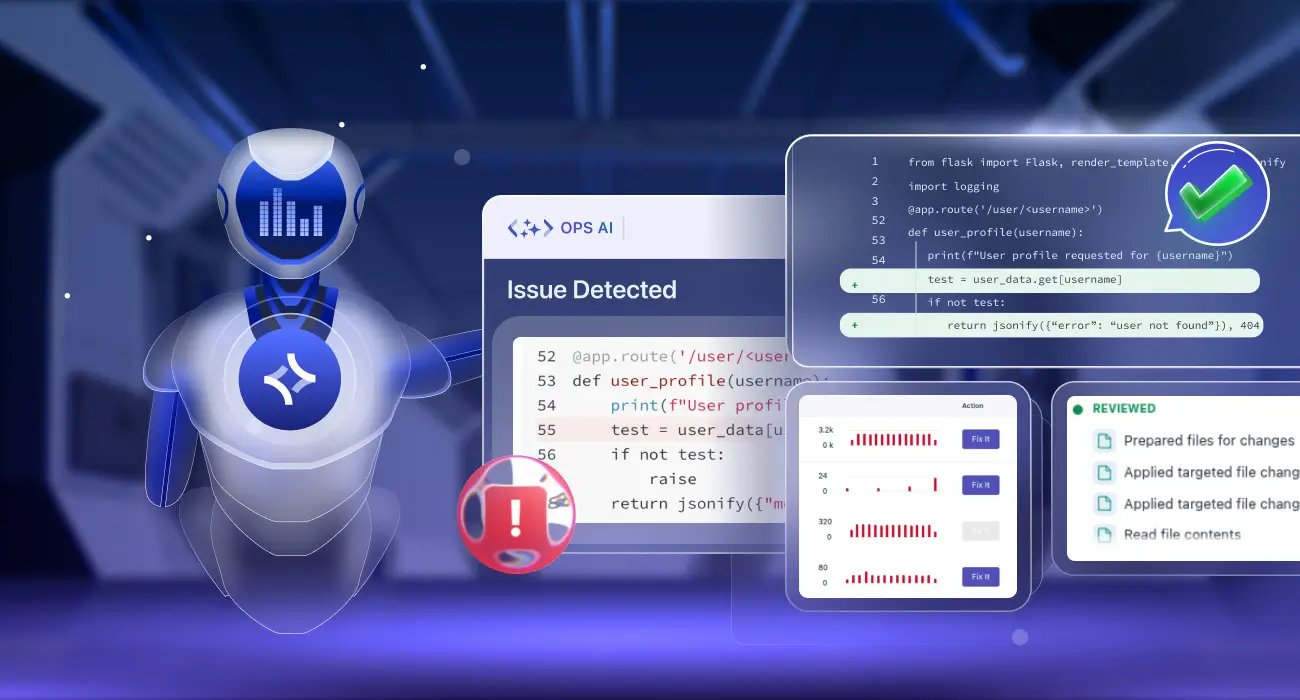
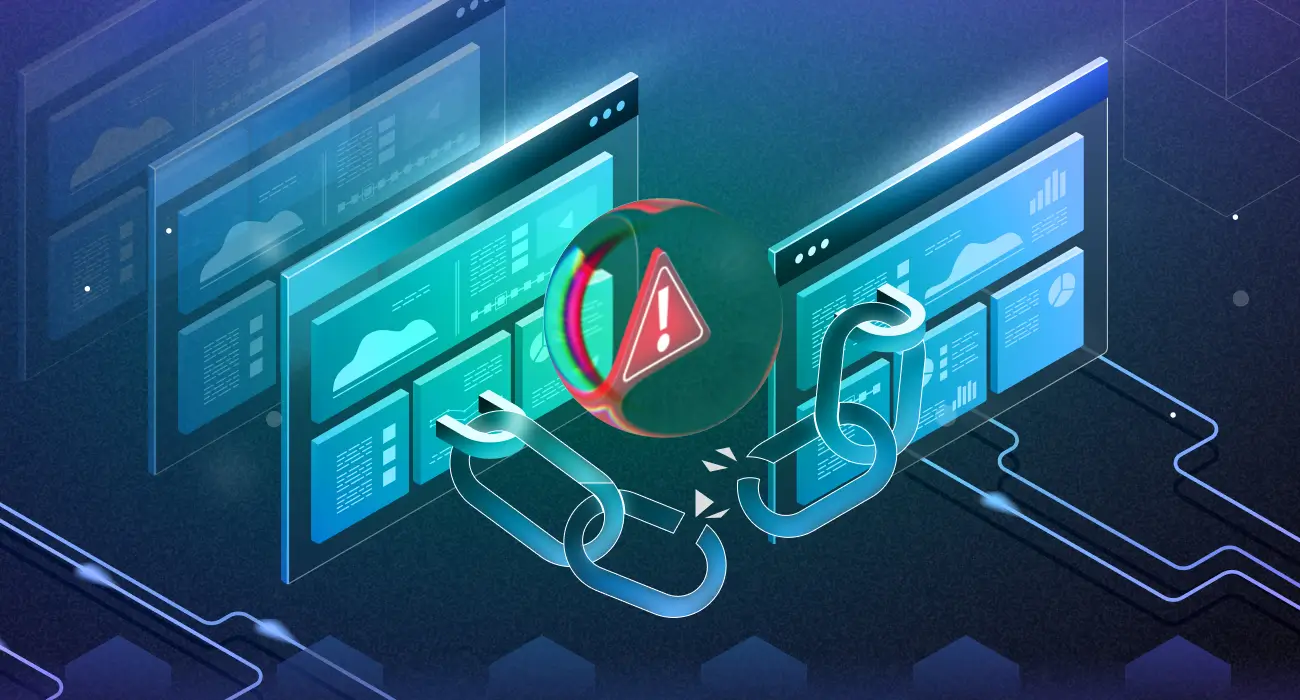
OpsAI for Repeat Incidents: How Automated Incident Response Prevents the Same Outage Twice
Summary: Repeat incidents are not bad luck they are a failure of incident memory. Most production systems alert on symptoms, restart pods, and close tickets, but never retain the pattern so they can recognize the same failure next week. This post explains exactly how Middleware OpsAI delivers automated incident response across your full stack: using…
-
Database Optimization: A Complete Guide to Faster Queries and Better Performance
Summary: Database optimization is the practice of tuning queries, indexes, and infrastructure so your database returns results faster while using fewer resources. Most performance problems come from missing indexes, inefficient queries, or undersized resources, and most can be fixed without rebuilding your system. The biggest mistake teams make is optimizing before measuring, which wastes time…
-
Bring Observability Directly Into Your IDE with Middleware MCP Server
Summary Every time an alert fires, most developers open four tabs before they write a single line of code. Middleware MCP Server eliminates that pattern by connecting AI-powered IDEs directly to your observability data via 21 structured tools that cover APM, logs, metrics, traces, dashboards, error tracking, and incidents. Investigation, triage, and root cause analysis…
-
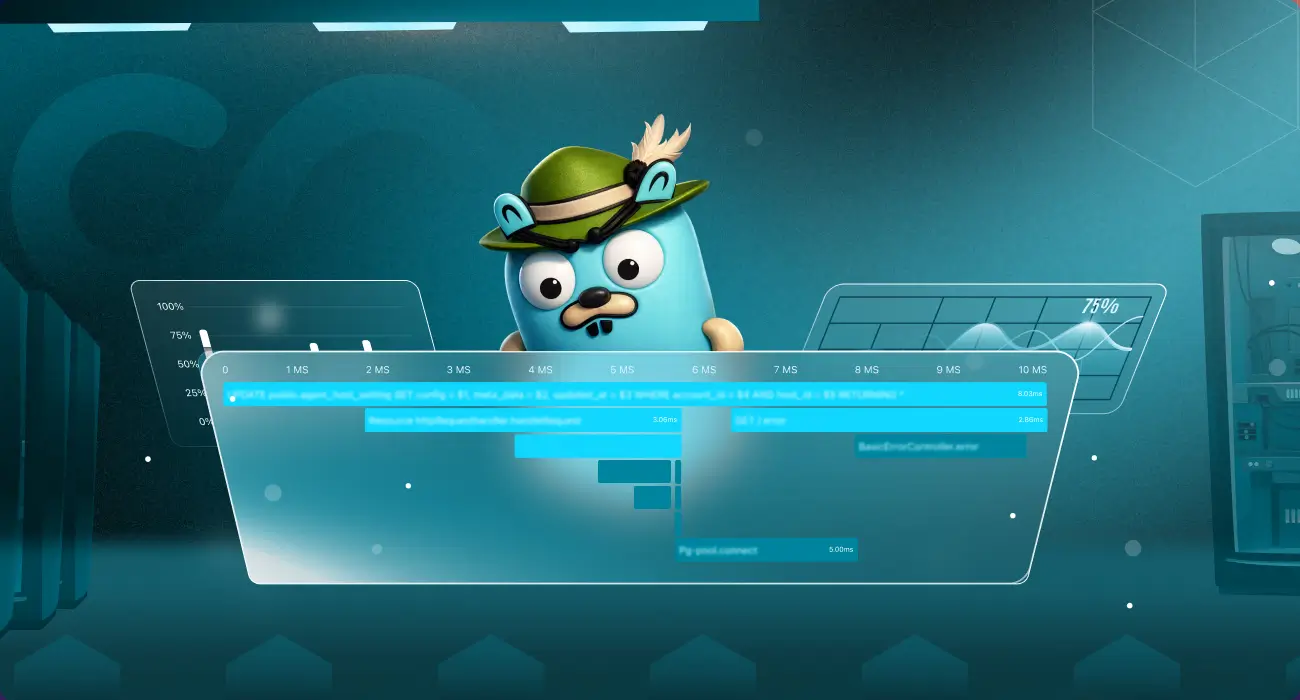
What Is Jaeger Tracing? A Beginner’s Guide to Distributed Tracing
Summary: Jaeger tracing is an open-source distributed tracing system that helps track requests as they move across multiple services. It collects trace data through OpenTelemetry, stores it in a supported backend, and provides a UI for searching and visualizing traces. Jaeger tracing helps engineers identify latency issues, service failures, and performance bottlenecks in distributed systems.…
-

Why Middleware Earned G2 Recognition: Real Users Explain the Impact
TL;DR Middleware earned G2 recognition based on verified reviews from DevOps engineers and SREs at organizations ranging from startups to enterprise IT. The most cited benefit is unified observability replacing three to five siloed tools with a single correlated view of logs, metrics, traces, and RUM. Native OpenTelemetry integration covers Go, Python, Java, and other…
-
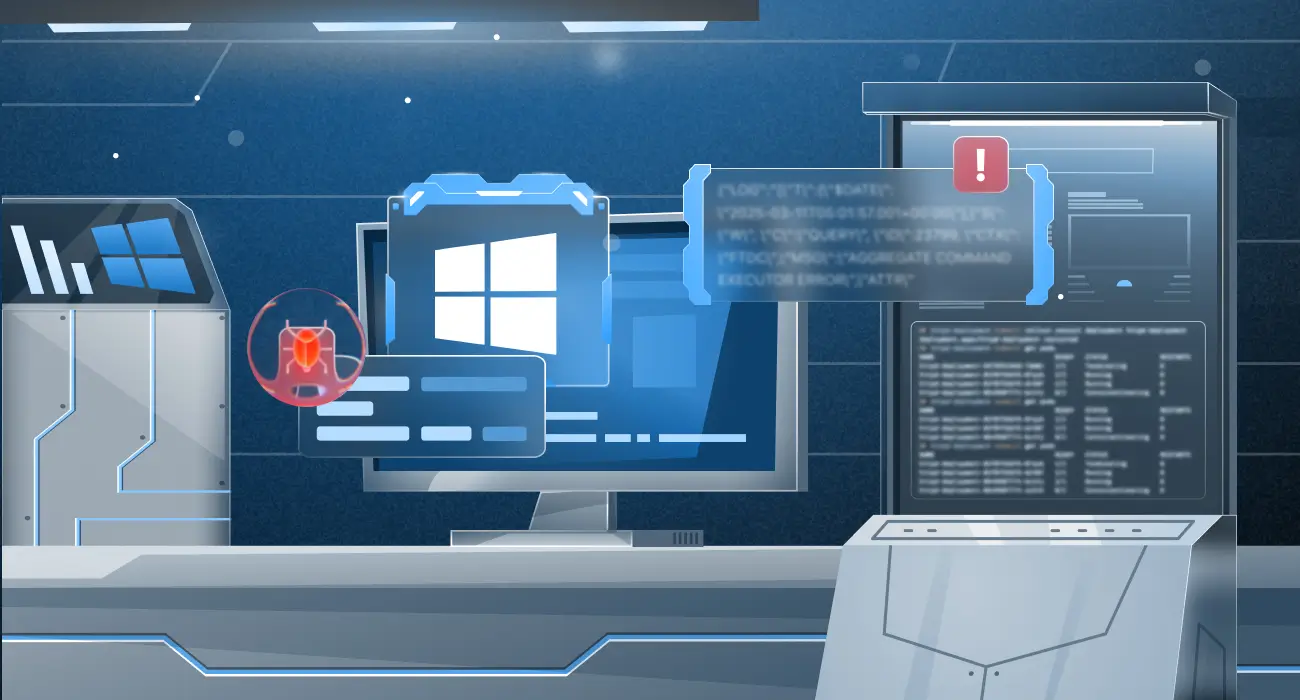
Windows Error Logs: How to Find, Read & Debug with Event Viewer
Windows error logs won’t tell you why a server is failing until you know exactly where to look, and Event Viewer’s Application, System, and Security channels bury the signal in noise fast. This guide shows you which Event IDs actually matter, how to query them with PowerShell, and how to go from alert to root…