Author: Keval Bhogayata
-
Docker Status: How to Check If Docker Is Down and Fix Common Errors
Docker status isn’t one thing. When a container looks off, you’re never sure whether to check the daemon, the container itself, or the app running inside it, and there’s no single docker status command that just tells you. This guide gives you the exact command for each of the three status types, so you can find what’s…
-
Kubernetes CrashLoopBackOff: Causes, Diagnosis, and Fixes
Summary: CrashLoopBackOff is one of the most common and most frustrating Kubernetes errors engineers face in production. It means a container keeps crashing and restarting in a loop, but the error actually causing it is hidden inside logs and exit codes that most guides gloss over. This article covers every root cause in depth, gives…
-
Docker Health Checks: How to Monitor, Configure, and Troubleshoot Container Health
Docker health checks are used to determine if an application running inside a container is actually functioning correctly and not just if the container process is running. A container can appear “up” while its application is unresponsive, misconfigured, or unable to reach required dependencies. Health checks solve this gap by actively validating real application behavior.…
-
How Middleware turns OpenTelemetry data into actionable intelligence – part 2
In part1, we covered how Middleware helps engineering teams new to OpenTelemetry achieve full infrastructure and application coverage in hours rather than weeks through auto-discovery, zero-code instrumentation, and UI-based collector configuration. In this blog post, I will be going to discuss about platform teams who are already using OpenTelemetry setup in their infrastructure and applications. What…
-
How Middleware makes OpenTelemetry-based observability setup faster – part1
TL;DR OpenTelemetry is the default choice for observability, but getting it fully configured across a real infrastructure can take two to three sprints. Middleware’s auto-discovery agent detects every application and database running across your entire host fleet in minutes no manual inventory. Zero-code instrumentation lets you instrument selected services without touching your codebase, using a…
-
What Is Jaeger Tracing? A Beginner’s Guide to Distributed Tracing
Summary: Jaeger tracing is an open-source distributed tracing system that helps track requests as they move across multiple services. It collects trace data through OpenTelemetry, stores it in a supported backend, and provides a UI for searching and visualizing traces. Jaeger tracing helps engineers identify latency issues, service failures, and performance bottlenecks in distributed systems.…
-
Kubernetes Deployment: The Misconfigurations That Cause Outages (and How to Fix Them)
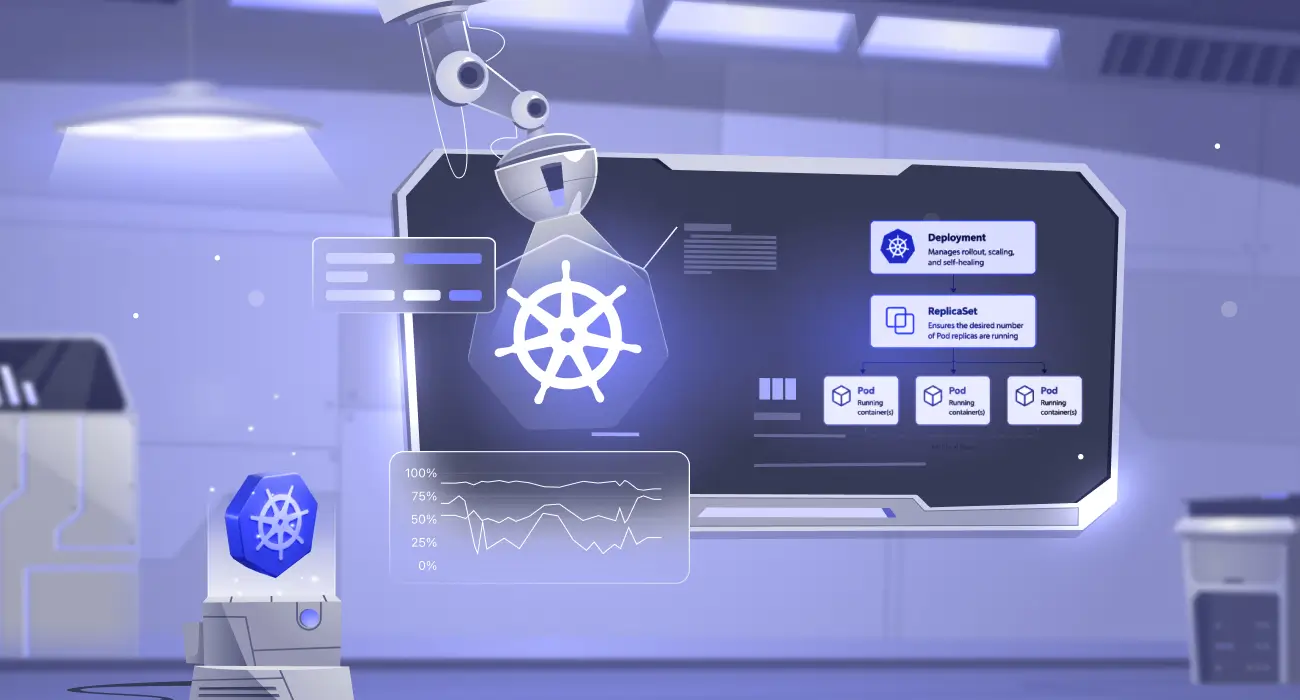
Summary: A Kubernetes Deployment is a declarative API object in the apps/v1 group that manages the full lifecycle of a set of identical Pods, including creation, scaling, rolling updates, self-healing, and rollback. It does not run containers directly; instead, it owns a ReplicaSet, which owns the individual Pods. This three-layer hierarchy — Deployment → ReplicaSet → Pod…
-
OOMKilled Kubernetes Error: How to Detect, Fix, and Prevent It
OOMKilled Kubernetes error is one of the most disruptive errors in containerized production environments. The Linux kernel kills your container mid-flight with no warning, drops all in-flight requests, and forces Kubernetes to restart the workload from scratch. If the root cause is not addressed, the cycle repeats until the pod enters CrashLoopBackOff and your service…
-
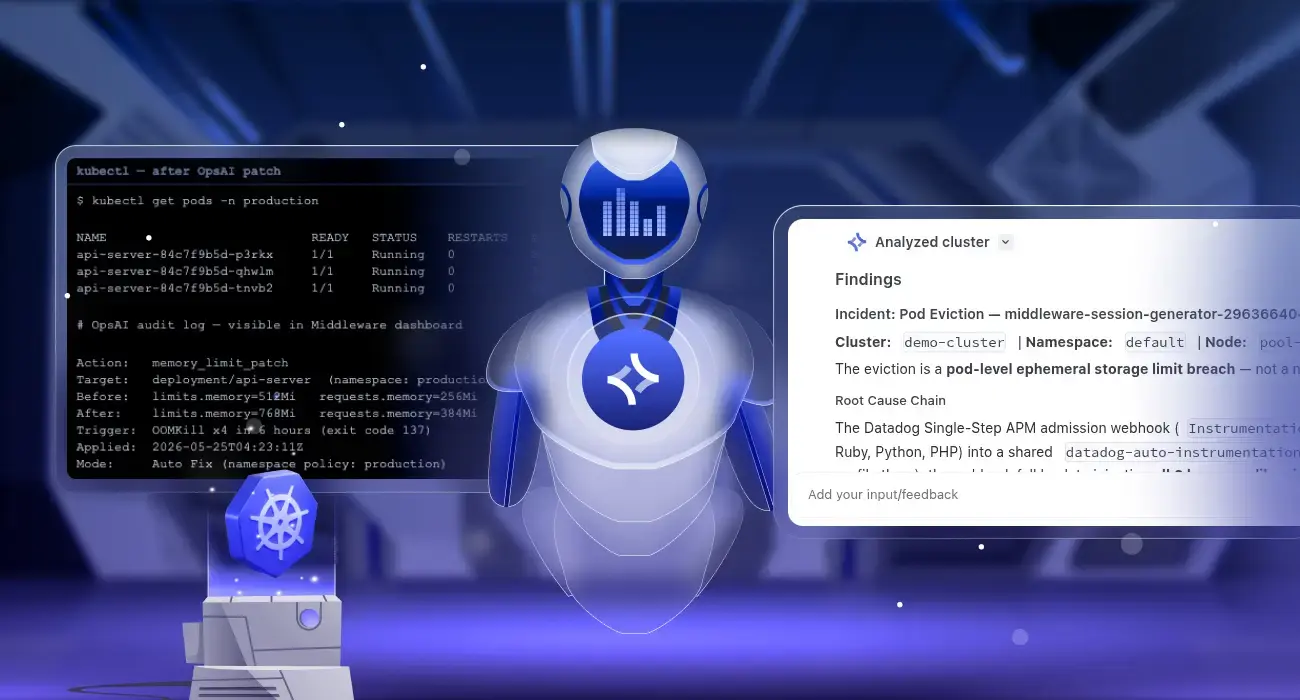
Kubernetes Self-Healing: Automatic Pod Crash Remediation with OpsAI
Kubernetes pod crash auto-remediation is the ability to automatically detect why a pod crashed and apply a permanent fix without human intervention. Middleware OpsAI does this by monitoring Kubernetes events, pod metrics, and container logs in real time, diagnosing the root cause of each failure, and patching the cluster directly, for example, raising a memory…
-
Kubernetes Infrastructure Monitoring: Complete Guide with Middleware
Kubernetes infrastructure monitoring tracks node CPU, memory, disk, and network health, as well as control plane and pod status, to surface problems before they affect users. Tools like Middleware provide pre-built dashboards and automated alerts that cut setup time from days to minutes. Table of Contents TL;DR Kubernetes infrastructure monitoring continuously tracks node CPU, memory,…
-
Kubernetes & Docker Exit Code 143: Meaning, Causes, and Debugging Guide
When you see exit code 143 and your container stops, the instinct is to assume something broke. In most cases, the container received a shutdown signal and exited on its own. What matters is whether your application handled that signal correctly. In production, how your application handles that shutdown determines whether users see dropped requests,…
-
Monitor Logs from Amazon EKS on Fargate with Middleware
Amazon EKS on Fargate is a fully serverless Kubernetes environment, with no EC2 nodes to manage, no DaemonSets and no host filesystem access. That architecture simplifies operations but breaks traditional observability tools that rely on node-level agents. This guide shows you how to monitor EKS Fargate workloads using Middleware. You will configure log routing via…