Category: Best practices
-
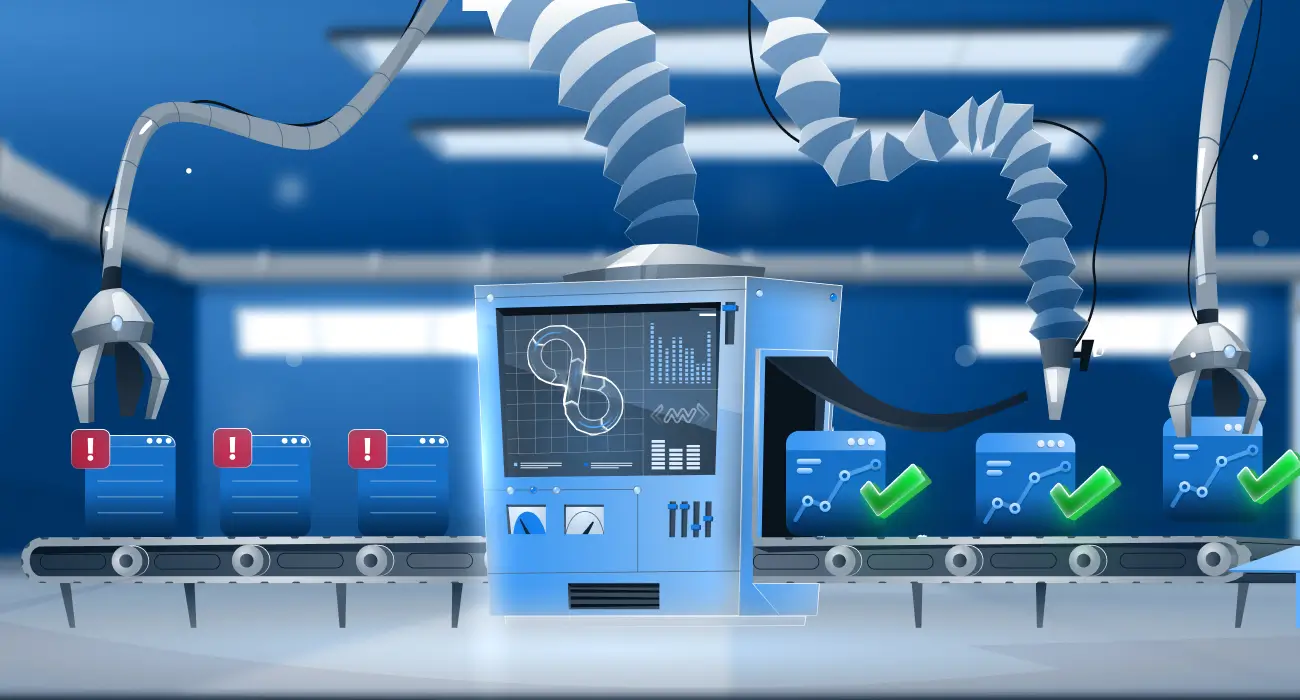
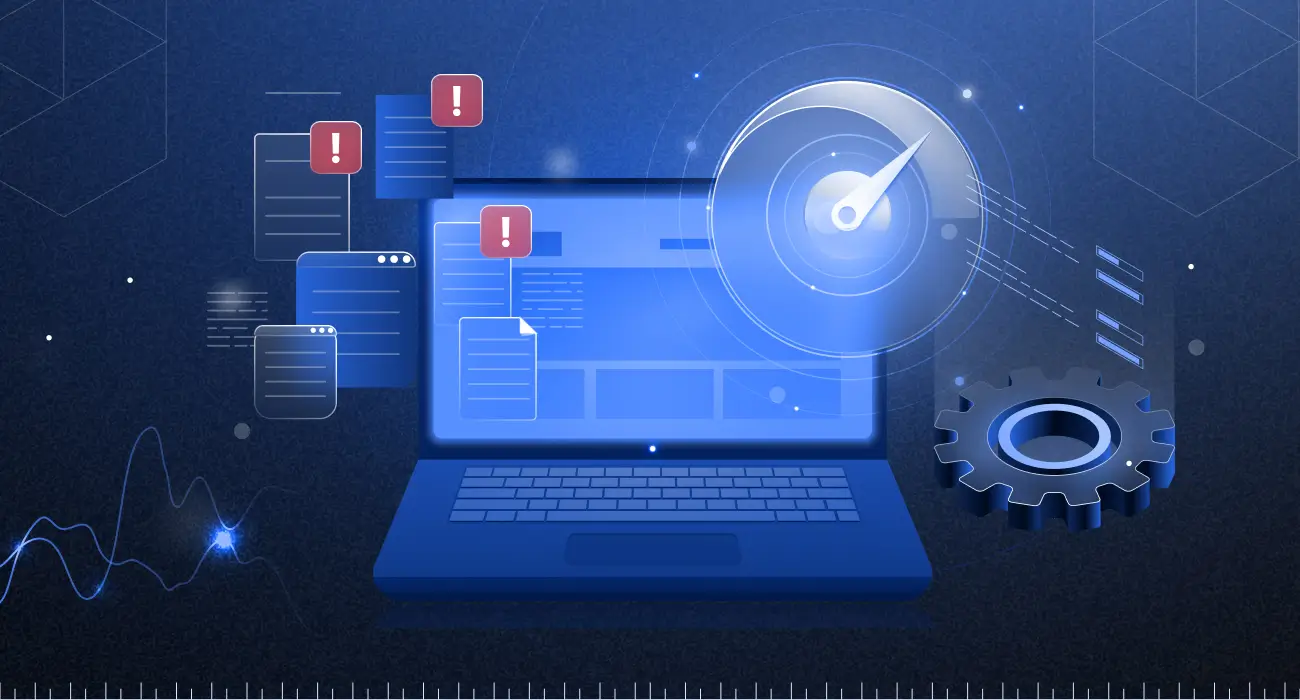
5 practices high-performing DevOps teams use to cut MTTR in half
The difference between a 10-minute incident and a 2-hour outage often comes down to five specific practices. Teams that master these consistently report 50% faster resolution times and significantly fewer escalations. This guide breaks down what those practices are, why they work, and how to start implementing them today. Tool sprawl is one of the…
-
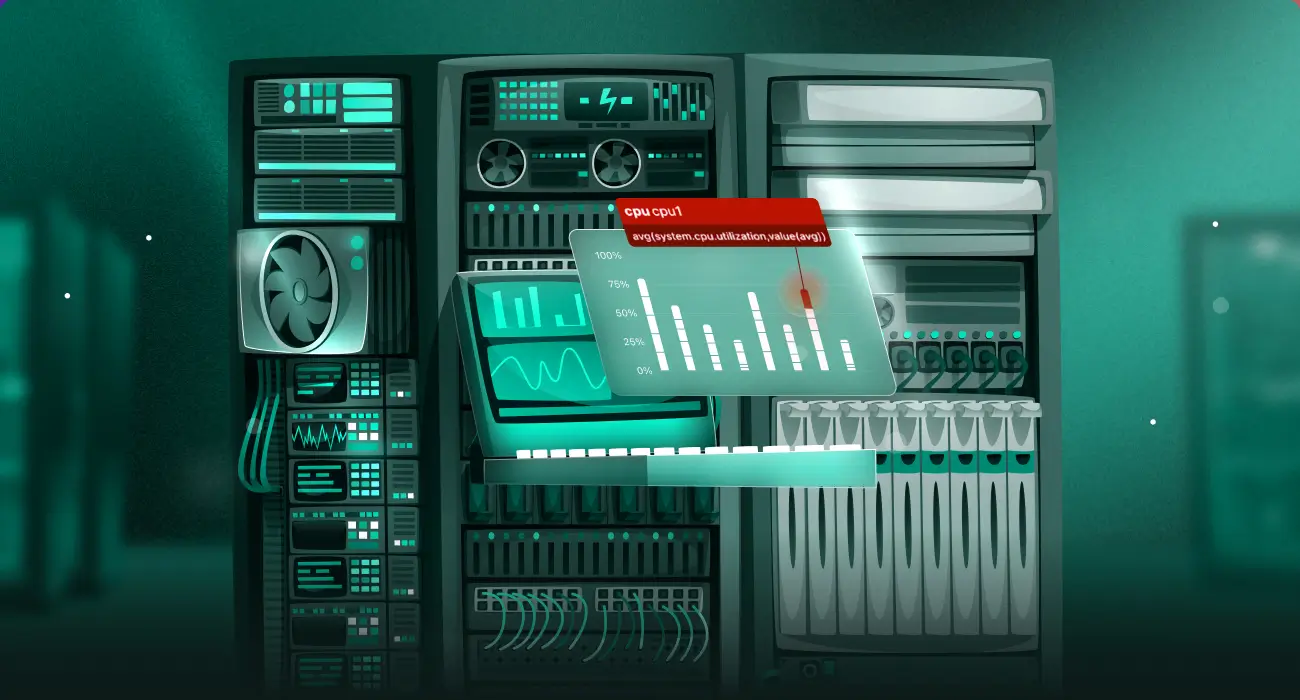
Kubernetes Infrastructure Monitoring: Complete Guide with Middleware
Kubernetes infrastructure monitoring tracks node CPU, memory, disk, and network health, as well as control plane and pod status, to surface problems before they affect users. Tools like Middleware provide pre-built dashboards and automated alerts that cut setup time from days to minutes. Table of Contents TL;DR Kubernetes infrastructure monitoring continuously tracks node CPU, memory,…
-
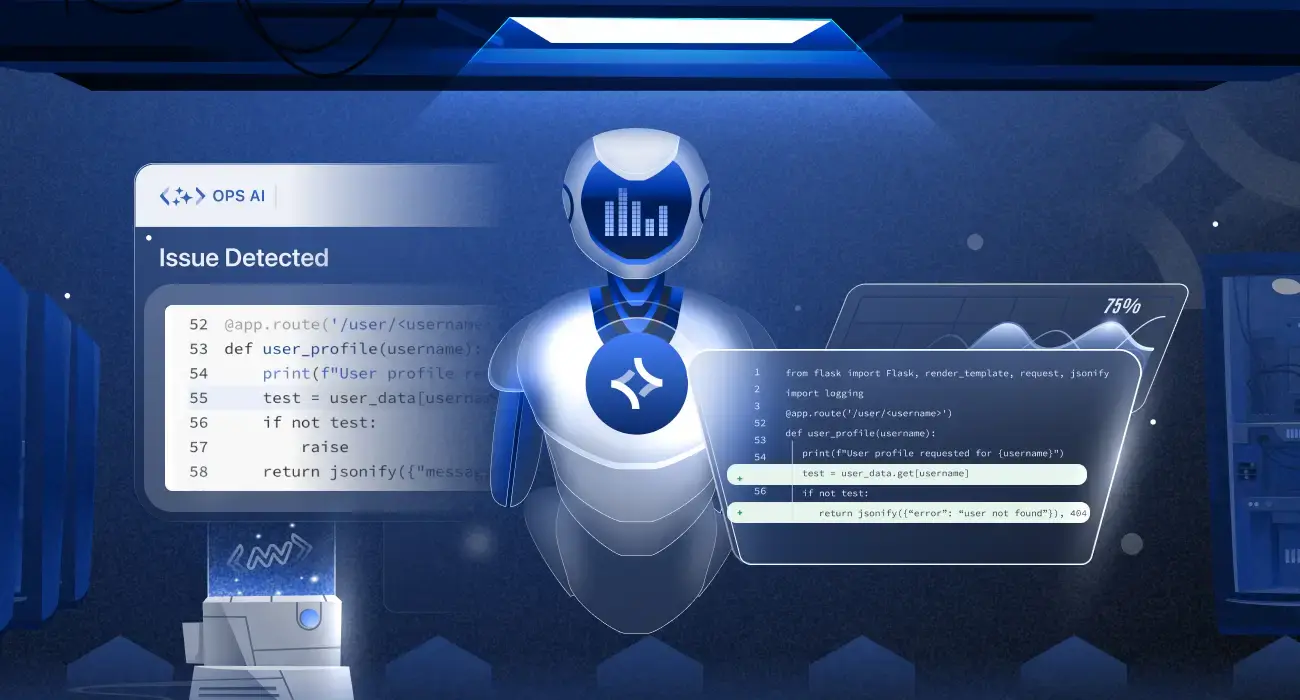
Introducing Middleware OpsAI: The AI SRE Agent That Resolves Production Issues Before They Reach Your Users
Summary: OpsAI is Middleware’s AI-native SRE agent that detects, diagnoses, and fixes production issues across APM, RUM, Logs, Kubernetes, and even third-party tools like Datadog and Grafana. Built on top of Middleware’s full-stack observability platform, OpsAI doesn’t just tell you something broke — it tells you why, where, and ships a pull request with the…
-
Monitor Logs from Amazon EKS on Fargate with Middleware
Amazon EKS on Fargate is a fully serverless Kubernetes environment, with no EC2 nodes to manage, no DaemonSets and no host filesystem access. That architecture simplifies operations but breaks traditional observability tools that rely on node-level agents. This guide shows you how to monitor EKS Fargate workloads using Middleware. You will configure log routing via…
-
How to Monitor Virtual Machines with Middleware
Virtual machine (VM) monitoring tracks CPU, memory, disk, and network performance in real time, allowing infrastructure teams to detect and resolve issues before they affect users. 📖 New to infrastructure monitoring? Read our foundational guide → What Is Infrastructure Monitoring? This guide covers how to deploy Middleware’s OpenTelemetry-based monitoring across VMs on AWS, Azure, and…
-
Frontend Performance Metrics: Bridging the Gap from Browser to Backend with RUM and Tracing
Frontend performance metrics measure how quickly and smoothly a web or mobile application behaves for users. This includes load time, interactivity, and visual stability across different devices, browsers, and app environments. Frontend performance metrics often show that something is wrong, but they fail to explain who is affected, how it impacts users, and where the…
-
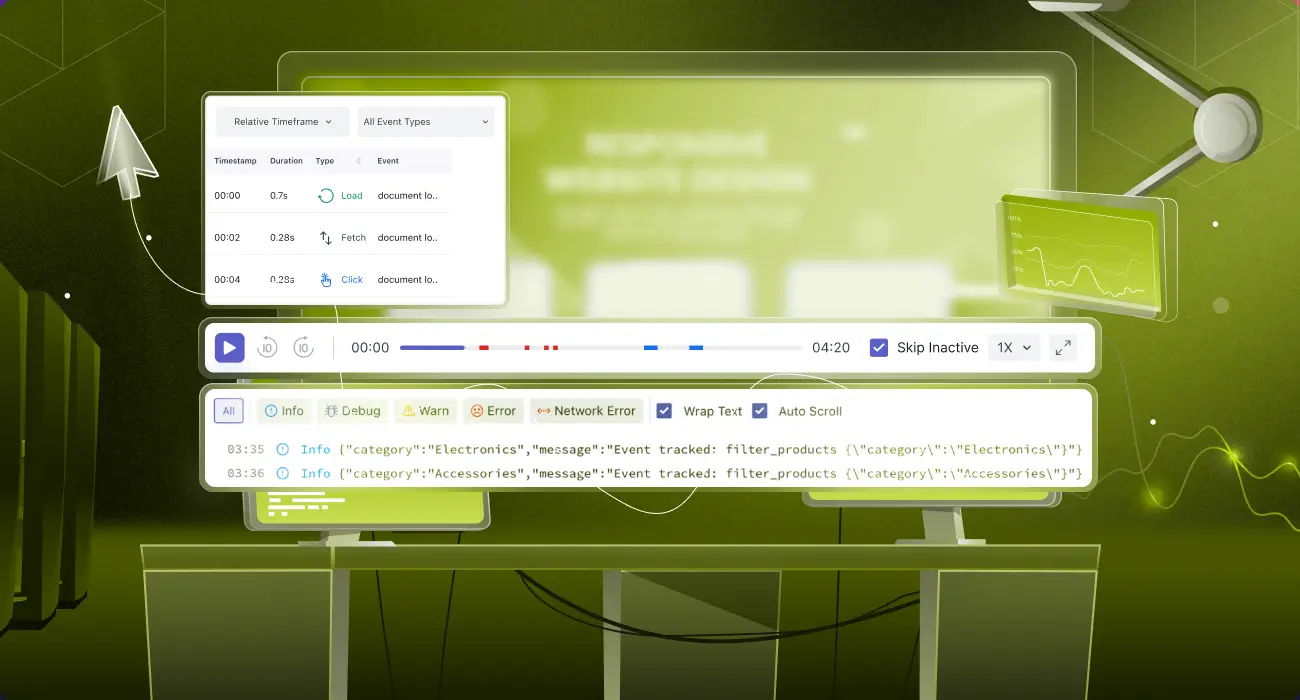
How a SaaS Team Scaled End-to-End Browser Tests with Middleware Synthetic Monitoring
An EdTech platform with 200k users learned a hard lesson in reactive monitoring. After a Friday deployment, their status page was green, but their checkout was dead for iOS 14 users. It took two hours to diagnose while revenue leaked. By pivoting from manual regression to a Synthetic-First Observability Strategy with Middleware, they cut detection…
-

How to Do Effective Infrastructure Monitoring for Windows with Middleware
Learn how to set up Windows infrastructure monitoring with Middleware. Track CPU, memory, disk, and network metrics and detect issues before they impact users.
-

Observability Predictions for 2026
Discover the top observability trends for 2026, including proactive AIOps, OTel adoption, cost-aware telemetry, and deeper, intelligent insights.
-
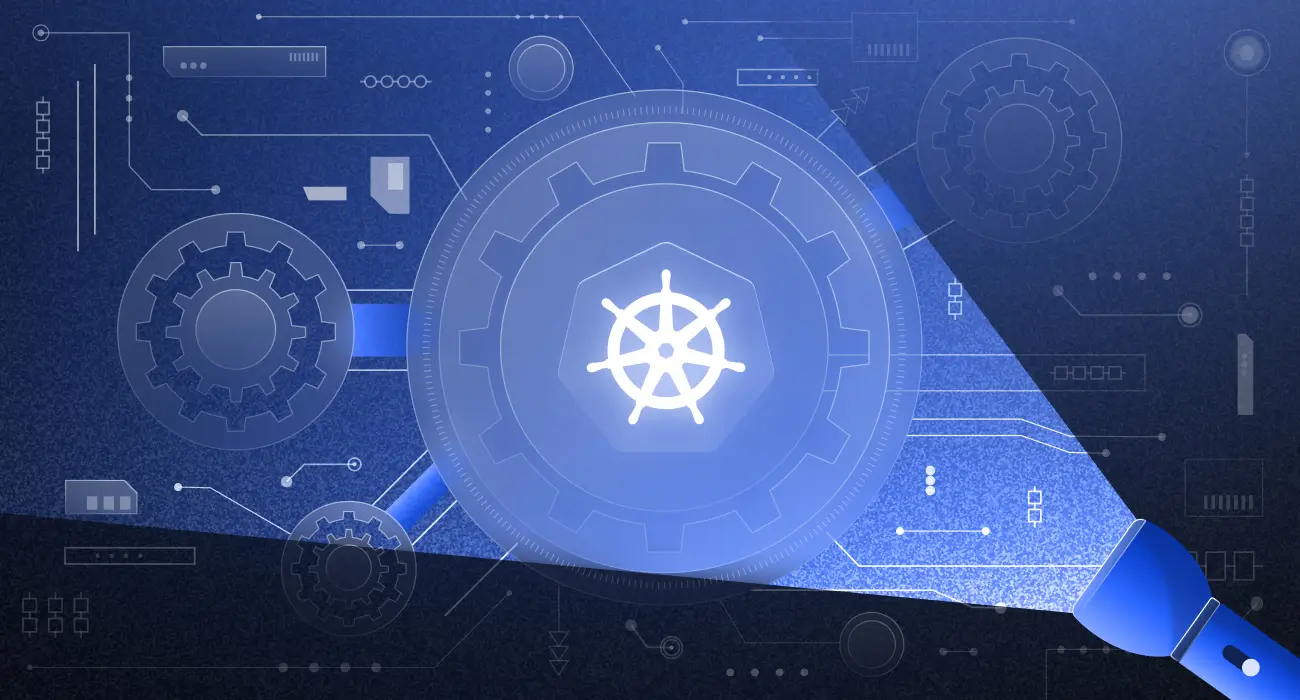
Top 10 Kubernetes (K8S) Troubleshooting Techniques
Regardless of its popularity, Kubernetes can fumble even the most seasoned DevOps engineers. While it excels at handling containerised applications at scale, it presents unique Kubernetes troubleshooting challenges. In this post, we’ll explore the top 10 Kubernetes troubleshooting techniques that every DevOps engineer should master. These K8s troubleshooting tips come from real-world scenarios, showing how…
-
14 Common Application Performance Issues & How to Fix Them
Whether you’re powering a Black Friday sale on an e-commerce platform, handling real-time dashboards in a SaaS app, or running a mobile app with thousands of daily active users performance issues can surface anytime and for anyone. From slow API responses during peak traffic, to laggy frontend interactions on older mobile devices, or database queries…
-
How Middleware Helps Catch Deployment Issues Before They Hit Users
Catch deployment issues before your users do. Learn how Middleware helps DevOps teams monitor errors, latency, and resource spikes in real time—ensuring smooth, reliable releases every time.