Author: Keval Bhogayata
-
13 Best Docker Monitoring Tools for Every Stack in 2026
Docker monitoring tools track the performance, health, and resource usage of Docker containers, images, and hosts in real time. Teams use them to detect issues before containers crash, optimize resource consumption, and maintain reliable containerized applications. These tools range from single-purpose log viewers to full-stack observability platforms. What makes them different is the signals they…
-
Docker Swarm vs Kubernetes: Complete Comparison for Container Orchestration
Docker Swarm and Kubernetes are two of the most prevalent container orchestration solutions when teams begin considering one. While these two tools address the same fundamental issue, they do so in quite different ways. In 2026, choosing between these two tools may affect your infrastructure, your team’s workflow, and your future expenses. Docker Swarm is simpler…
-
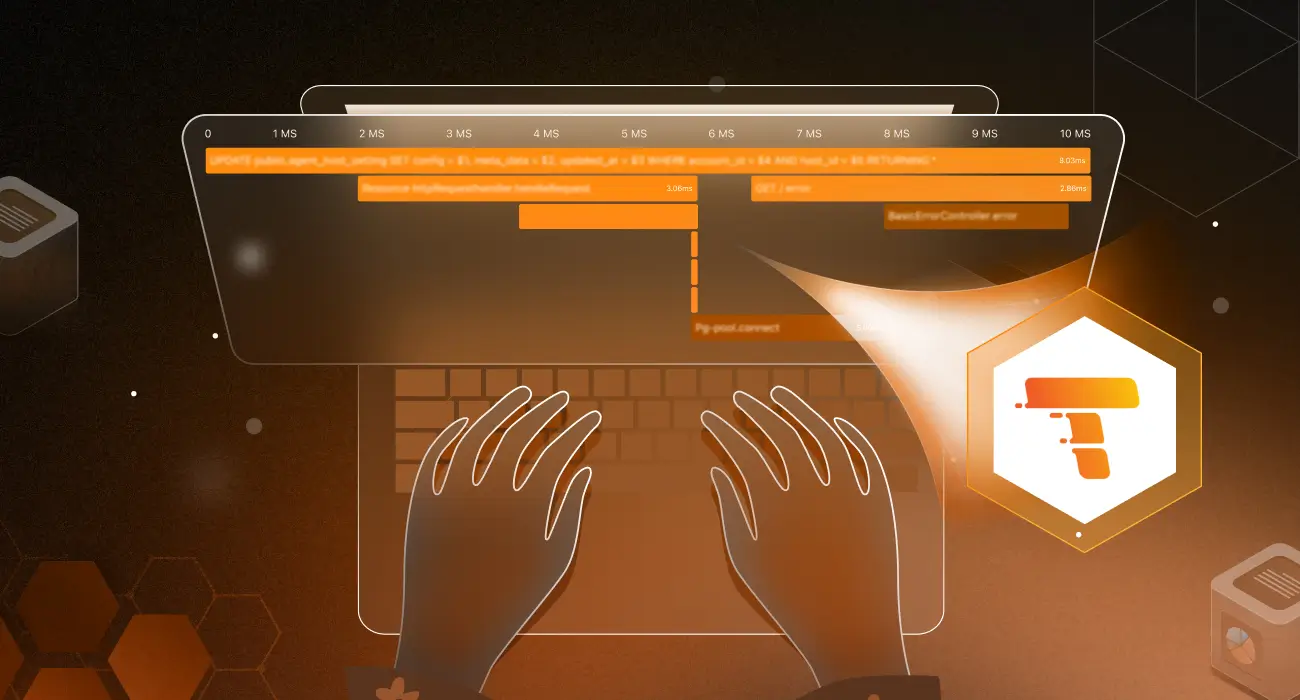
The Complete Guide to Observability Pipelines
You know that moment when something breaks in production? Alerts go off, you open logs, and it’s just… noise. Different formats, useless messages, missing context, and the one thing you need isn’t there. That’s the current state of telemetry for most teams. An observability pipeline sits between your data sources and your monitoring tools. It…
-
Diagnosing Abnormal Kubernetes Workload Behavior with Observability
Troubleshoot Kubernetes workload issues faster with unified metrics, events, and logs. See how full-stack observability helps identify root causes in minutes.
-
Grafana Tempo: Simplifying Distributed Tracing at Scale
Learn how Grafana Tempo simplifies distributed tracing at scale using object storage and how to get started with TraceQL, Helm, and Grafana
-
What Is Grafana Loki? A Guide to Effective Log Aggregation
A complete guide to Grafana Loki, including label-based log storage, LogQL queries, Kubernetes logging, and LGTM stack integration.
-
Troubleshooting Common Kubernetes Workloads Issues with Middleware
Troubleshoot Kubernetes workloads efficiently with Middleware. Detect CrashLoopBackOff, OOMKilled, and FailedMount errors in real time and reduce downtime.
-
OpenTelemetry Collector vs Agent: How to Choose the Right Telemetry Approach
Compare OpenTelemetry Collector vs Agent, learn when to use each, and see how Middleware simplifies observability with unified telemetry insights.
-
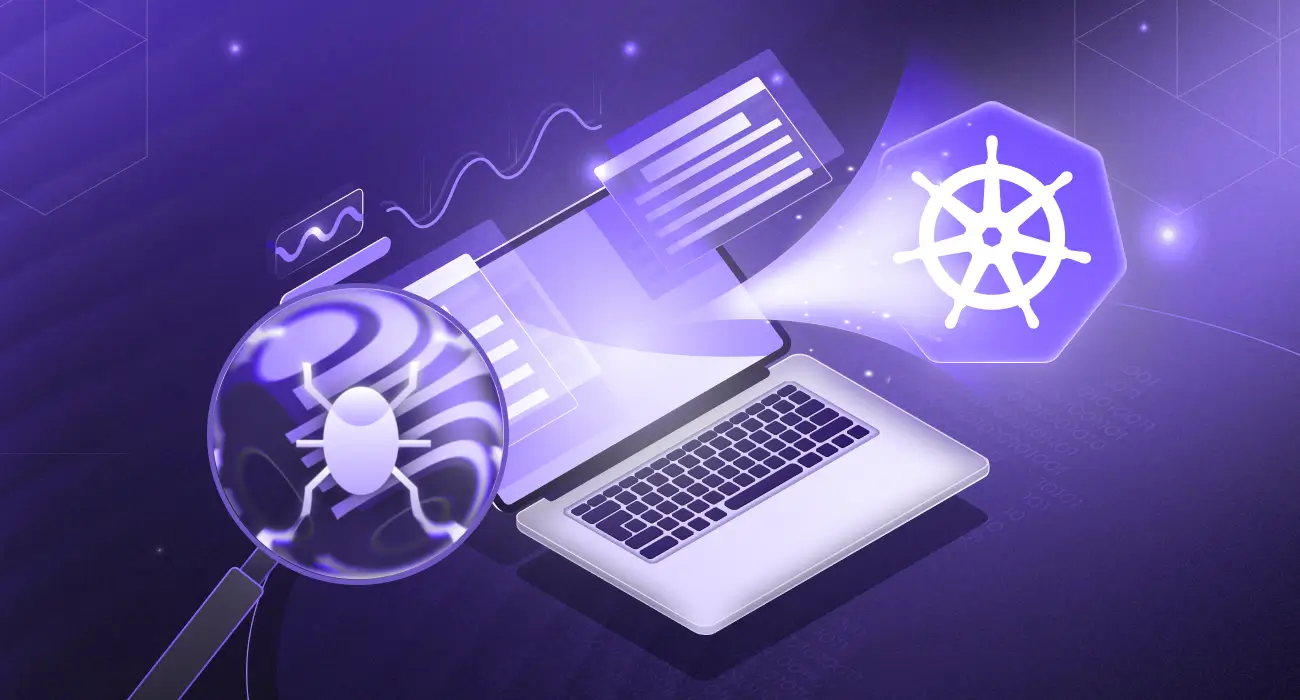
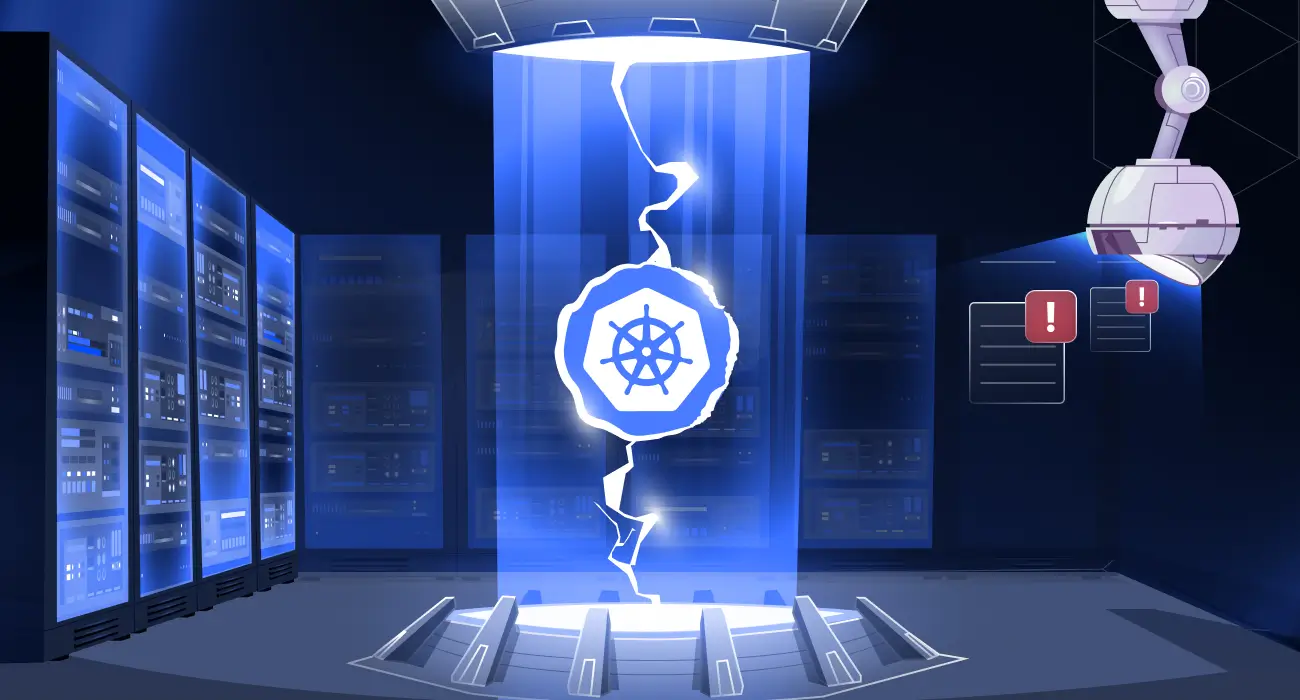
Kubernetes Common Errors & How to Fix Them
Learn to troubleshoot common Kubernetes errors like CrashLoopBackOff, OOMKilled, and ImagePullBackOff for smooth pod and cluster performance.
-
kubectl Restart Pod: 5 Methods to Restart Kubernetes Pods (With Commands)
Learn how to restart Kubernetes pods using kubectl, why it matters, and the safest methods plus monitor pods easily with Middleware for smarter decisions.
-
Automating Stateful Apps with Kubernetes Operators
Automate complex workloads with a K8 Operator. Simplify scaling, backups, upgrades, and observability for stateful apps like databases and message queues.
-
Monitoring Kubernetes Application with Middleware
Monitor your Kubernetes clusters application with Middleware. Get real-time dashboards, intelligent alerts, auto-discovery of pods and nodes, and centralized logs for smooth operations.