Author: Keval Bhogayata
-
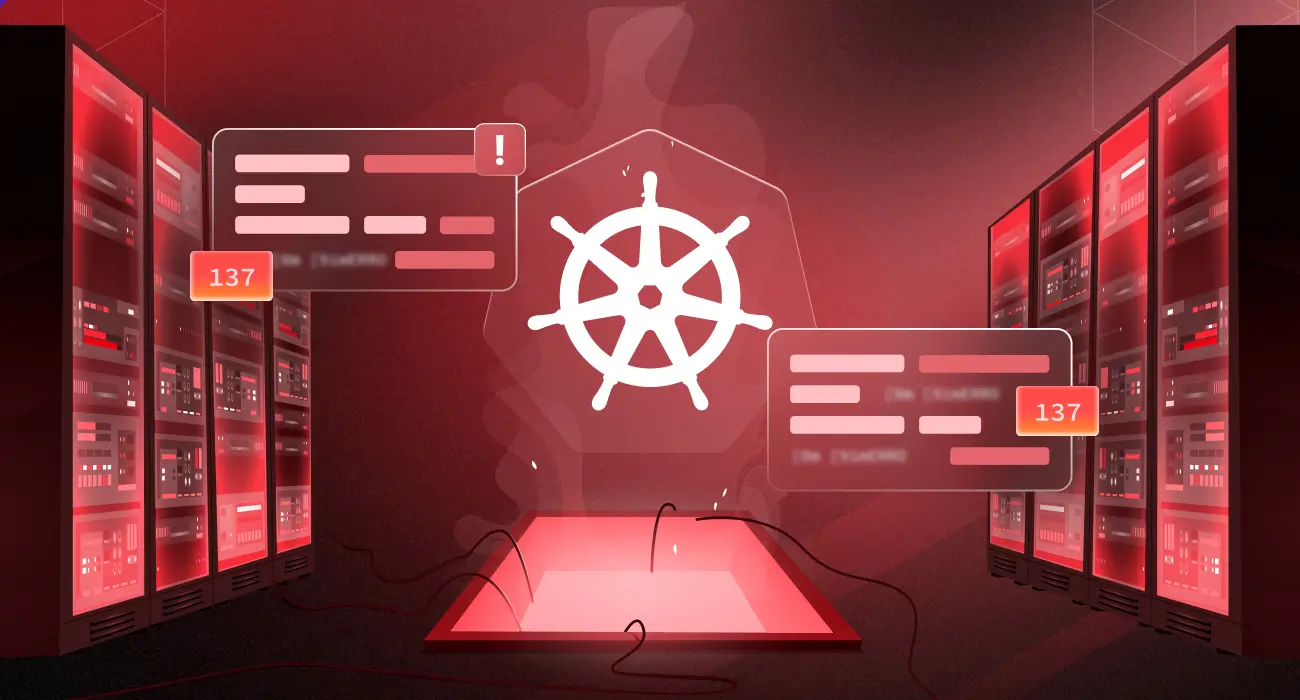
Exit Code 137 in Kubernetes: Causes, Diagnosis, and Fixes
Exit code 137 in Kubernetes means a container was killed with SIGKILL, usually due to running out of memory (OOMKilled). Learn the common causes, how to diagnose it, and the best fixes to prevent forced pod terminations.
-
Top 10 Kubernetes (K8S) Troubleshooting Techniques
Regardless of its popularity, Kubernetes can fumble even the most seasoned DevOps engineers. While it excels at handling containerised applications at scale, it presents unique Kubernetes troubleshooting challenges. In this post, we’ll explore the top 10 Kubernetes troubleshooting techniques that every DevOps engineer should master. These K8s troubleshooting tips come from real-world scenarios, showing how…
-
How to Manage Docker Container Logs for Monitoring & Troubleshooting
Learn how to manage Docker container logs effectively to streamline monitoring, troubleshoot issues faster, and optimize application performance.
-
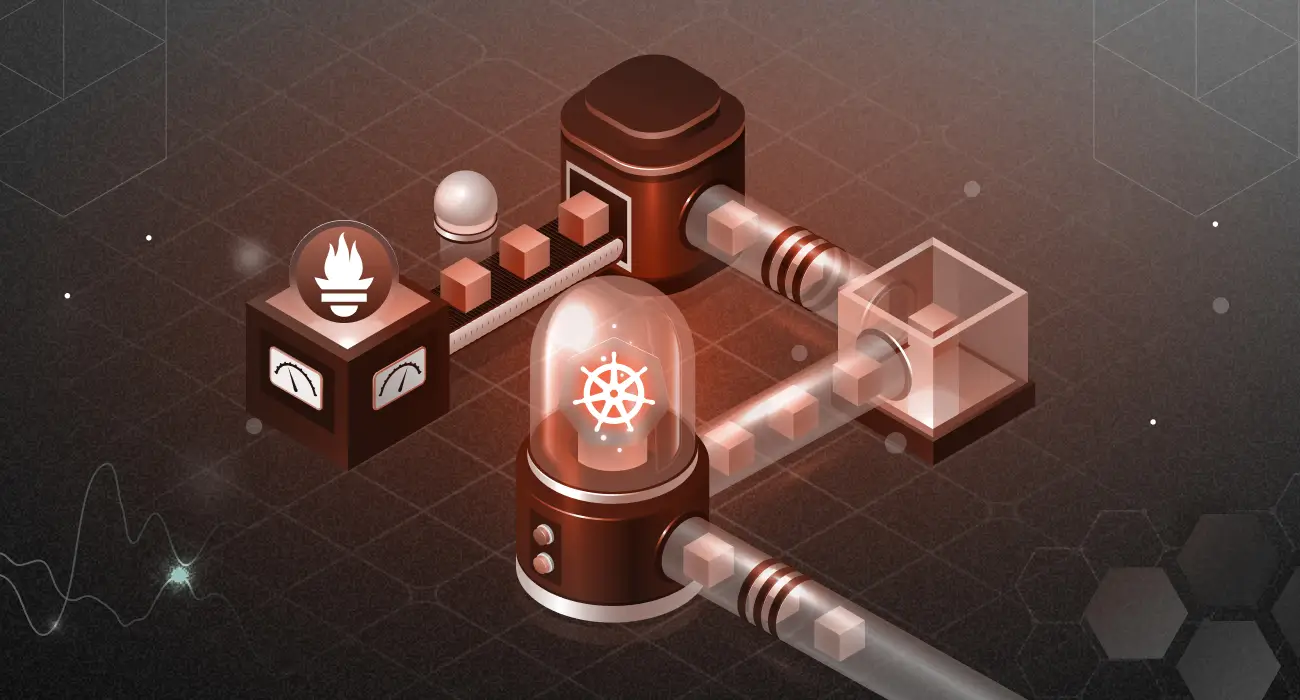
How to Use Prometheus Pod Monitor for Pod-Level Metrics Collection
Prometheus PodMonitor exists because a Kubernetes Service can’t always reach the pod you actually need metrics from, whether it has no Service in front of it or you’re scraping a sidecar. This guide covers how PodMonitor discovers and scrapes pods directly, how to configure and verify one from scratch, and the best practices that keep…
-
Prometheus Labels: Understanding and Best Practices
In observability, Prometheus is a well-known tool amongst SREs and engineers alike. What makes Prometheus so effective is the labels Prometheus implements, which provide context to its metrics and facilitate operations such as filtering and aggregations. New to Prometheus? Learn how it works and why it’s critical for observability in our beginner-friendly guide. By the…
-
Understanding API Metrics: What to Monitor in Your API
APIs have significantly changed the way modern software applications are developed. They allow communication and transfer of information between different systems. As many organizations now adopt the API-first design, developers, DevOps, and Product teams need to understand how APIs work. Measuring these APIs’ performance is an important thing to consider because it helps assess their…
-
Kubernetes vs Docker: Understanding Their Roles and Differences
Kubernetes vs Docker – discover the key differences, use cases, and how they power modern DevOps and container orchestration.
-
Detailed Guide to Prometheus Metrics
Learn how to collect, analyze, and visualize Prometheus metrics effectively. This step-by-step guide covers counters, gauges, histograms, and summaries to help you monitor system performance with ease.
-

Prometheus vs Grafana: Which Tool Suits Your Monitoring Needs?
We tested them in a real-world cloud stack to uncover which tool deserves a place in your monitoring arsenal (and why most teams need both).
-
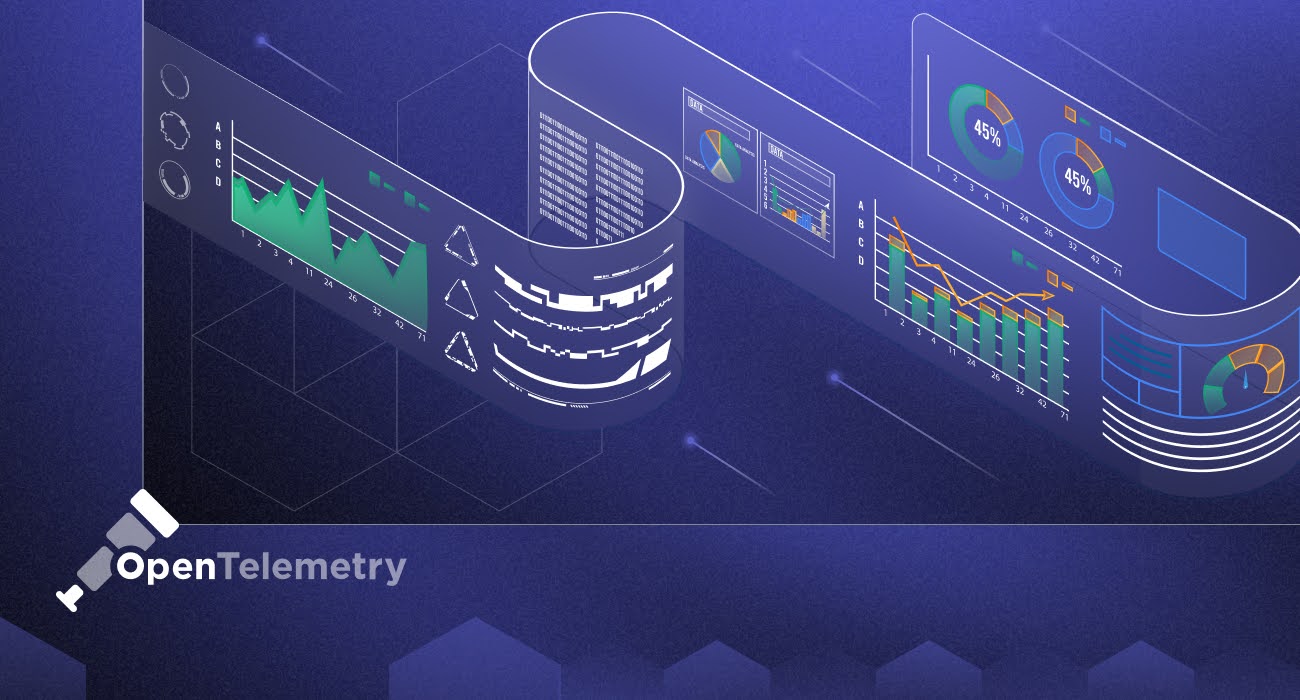
Understanding OpenTelemetry Metrics: Type, Models and Best Practices
Learn how OpenTelemetry metrics can help you track performance, optimize resources, and integrate with existing tools to improve overall observability and tackle issues before they start affecting end users.
-
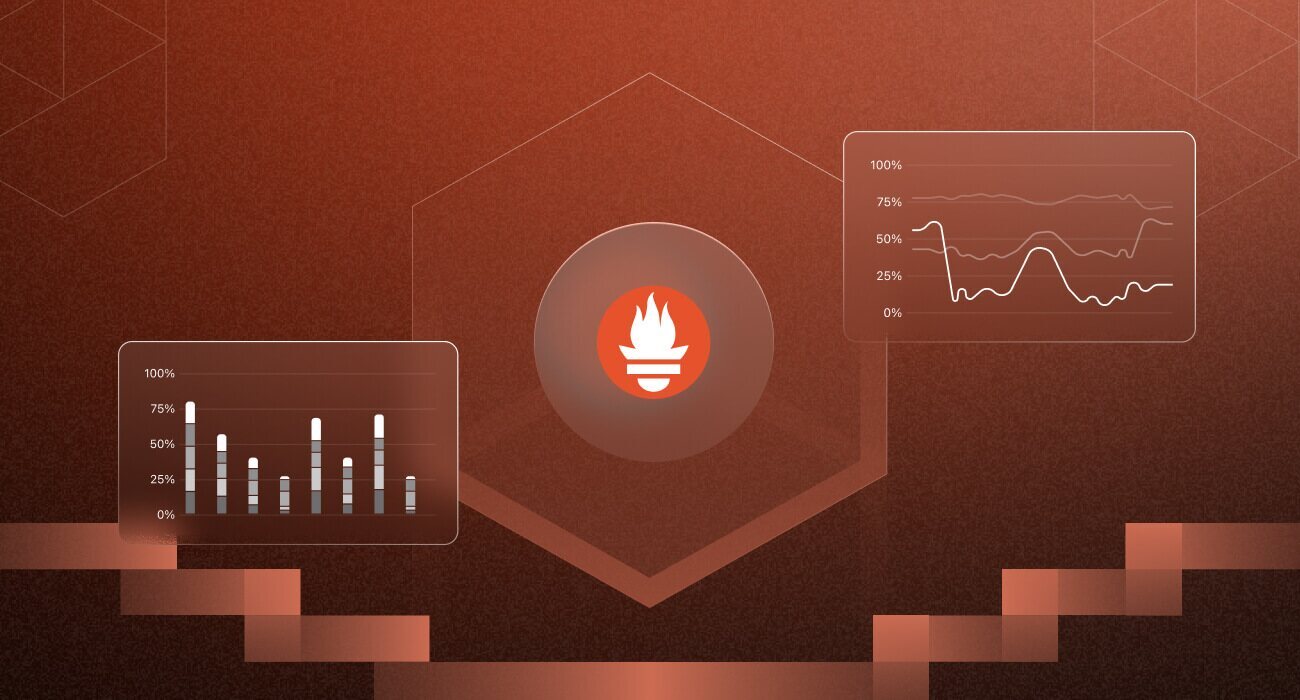
How Does Prometheus Work?
Prometheus is a powerful open-source tool widely used for collecting, storing, and analyzing metrics as part of the Prometheus architecture in modern cloud-native environments. It is an important aspect of modern observability technologies since it offers a scalable, pull-based data collection technique as part of the Prometheus architecture. It easily interfaces with cloud services like…
-
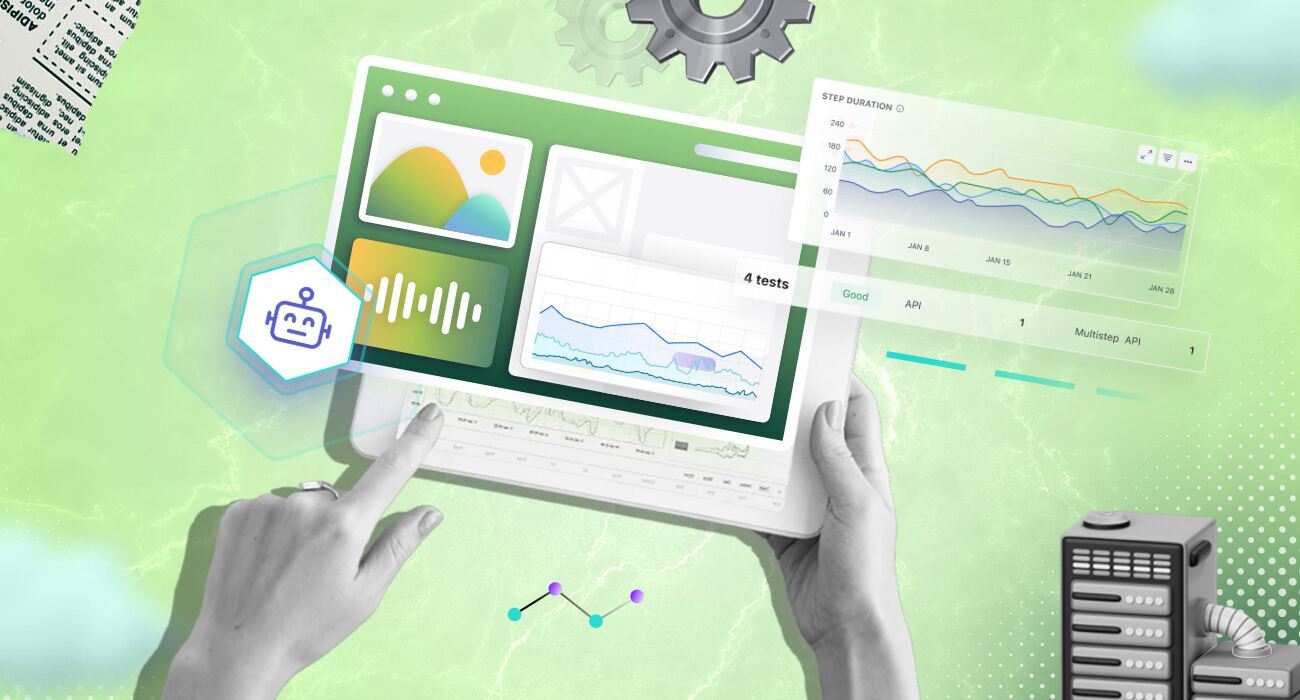
How can synthetic monitoring enhance website reliability?
Understand how you can proactively enhance your website’s performance and reliability with Middleware’s synthetic monitoring.