Author: Vivek Tilva
-
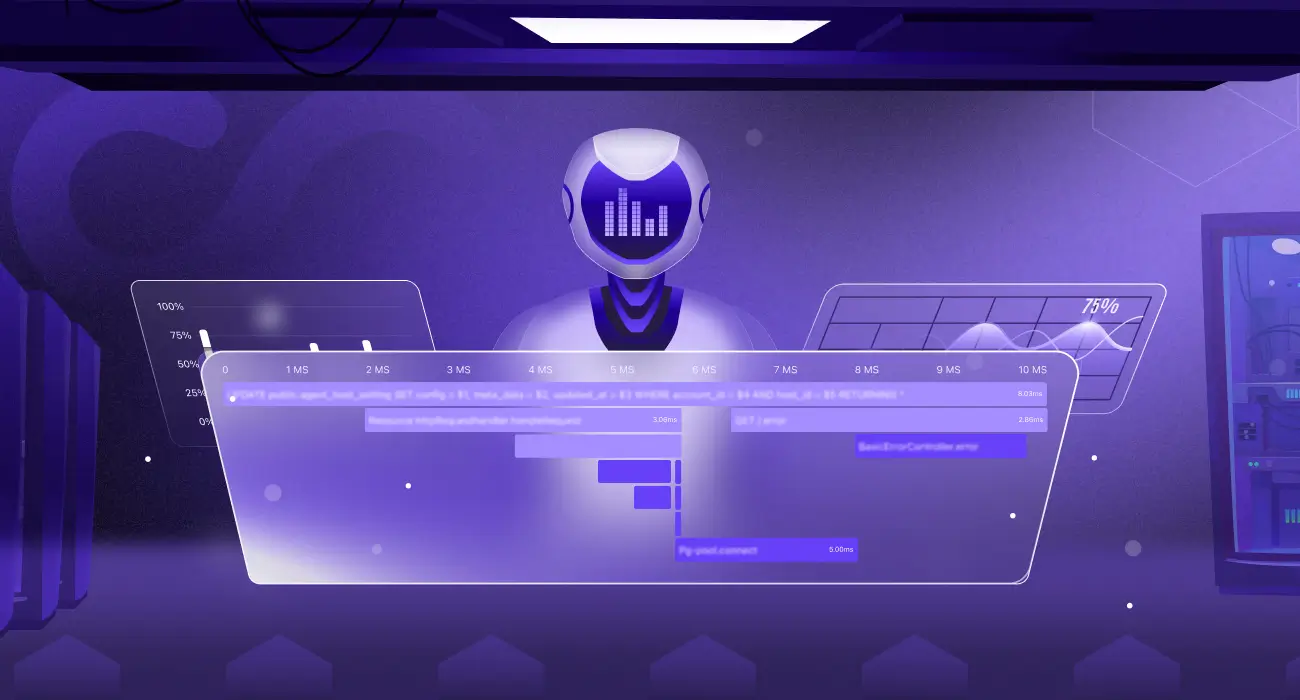
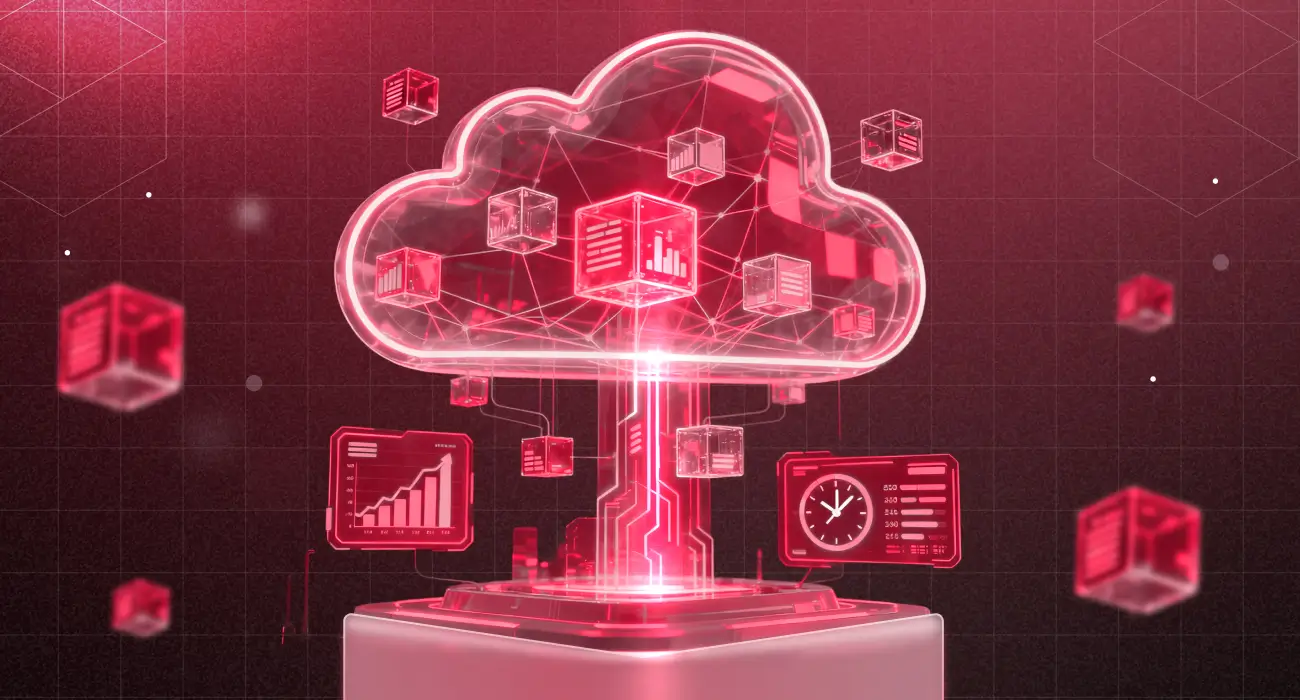
How AI-driven alerts caught a memory leak before it became an outage
A memory leak was growing quietly in production, invisible to threshold-based monitoring. Within hours of deploying the middleware, the team behind it received an AI-driven alert that flagged the anomaly before it could cascade into a full outage. TL;DR A memory leak grew silently in production until an AI-driven alert flagged the anomaly hours before pods would…
-
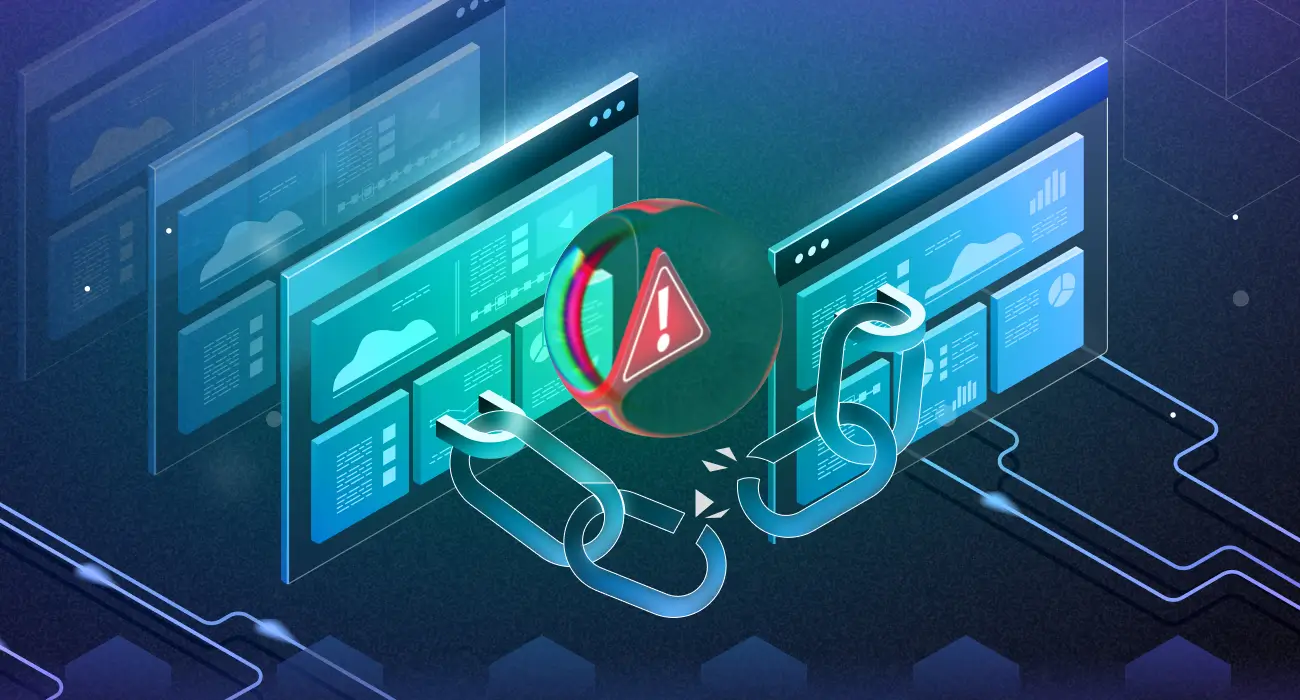
Logging vs Monitoring: What’s the Difference?
TL;DR: Logging records what happened inside your system. Monitoring watches whether your system is healthy right now. They answer different questions, and neither replaces the other. Logging and monitoring are two of the most commonly used terms in DevOps and engineering, often mentioned together, but they are not the same thing and do not do…
-

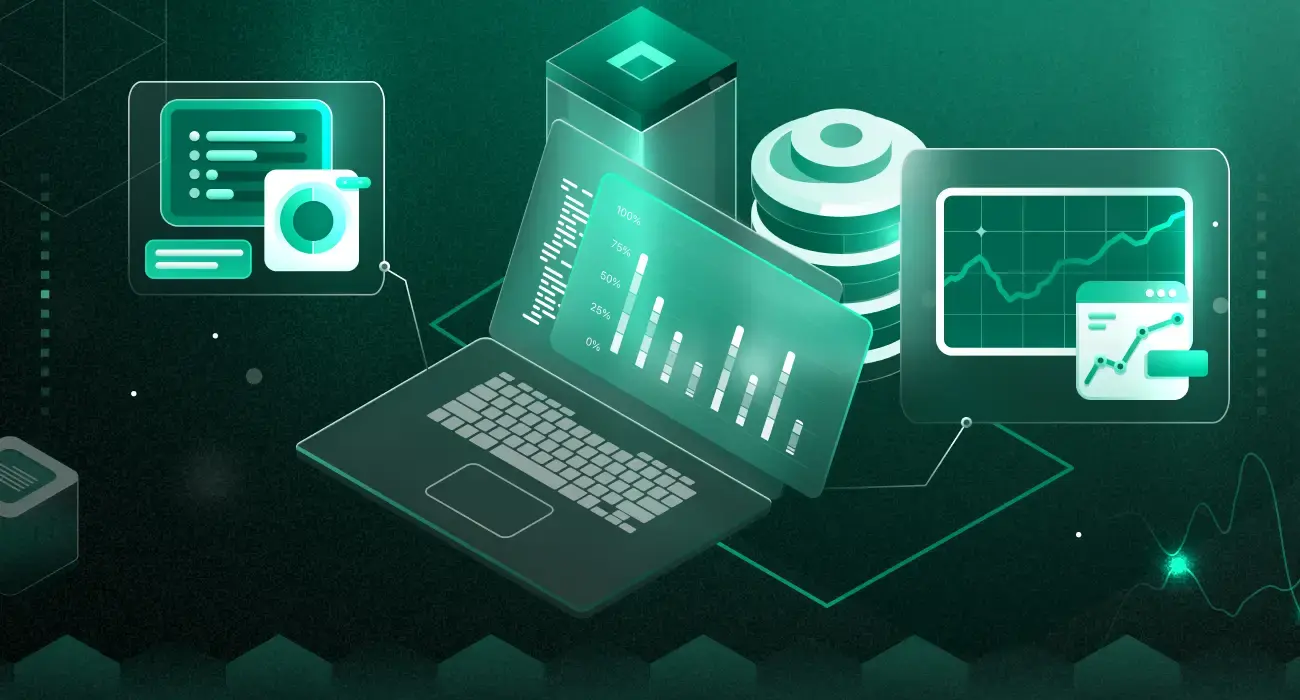
10 Best Log Aggregation Tools in 2026: A DevOps Engineer’s Comparison
Summary: The best log aggregation tools in 2026 are Middleware, SigNoz, and Grafana Loki for most teams, depending on whether you prioritize OpenTelemetry support, cost control, or Kubernetes compatibility. Read on for a full comparison by strength, pricing, and deployment model. A log aggregation tool collects logs from servers, containers, applications, and cloud services and…
-
Best 9 Distributed Tracing Tools in 2026
Distributed tracing tools track requests as they move across services, helping teams identify where slowdowns, failures, and bottlenecks occur in modern distributed systems. Modern applications don’t run in one place. A single user request can pass through multiple services, APIs, and databases before returning a response. When something slows down or breaks, it’s not enough…
-
Data Build Tool (dbt): A Complete Guide for Modern Data Teams
Learn how dbt simplifies data transformations using ELT, testing, documentation, and version control to build reliable analytics-ready datasets.
-
Real User Monitoring (RUM): 7 Ways to Improve User Experience
User Experience Monitoring helps you track real user behavior, detect problems faster, and improve performance for a smoother, more engaging digital experience.
-
Why Engineering Teams are Replacing 3–4 Tools with Middleware
Tired of juggling multiple tools? Middleware unifies logs, metrics, traces, and alerts in one platform, speeding up incident resolution and reducing costs.
-
A Comprehensive Guide to Latency Reduction and Performance Optimization
Find out the best ways to reduce latency in order to improve the performance of applications, networks, databases, and infrastructure.
-
Monitor Core Web Vitals With Rum And Synthetic Monitoring
Track and monitor core web vitals with RUM and Synthetic Monitoring to improve website performance and user experience.
-
What Is LLM Observability? How to Monitor LLM Apps
Discover the importance of LLM Observability. Learn how to optimize Large Language Model performance, detect issues, and ensure reliability.
-
How to Analyze AWS CloudWatch Resources, Data, & Metrics with Middleware
Explore how you can analyze AWS CloudWatch logs using Middleware. Learn to integrate, display, and visualize metrics with custom dashboards to optimize your AWS environment.
-
Monitoring Kafka Performance Metrics with Middleware
Discover how Kafka handles data influx, enabling real-time processing and distribution with low latency. Learn about Kafka’s architecture and key performance metrics to monitor with Middleware.