Businesses rely heavily on Application Programming Interfaces (APIs) to connect various systems and deliver experiences to users. However, ensuring the reliability and performance of these APIs poses a significant challenge.
API monitoring solutions have emerged as crucial tools to tackle this challenge, offering real-time insights into API health and performance, empowering businesses to deliver consistent, reliable services to their users.
More than 83% of web traffic flows through APIs today. Every search, payment, login, and data sync your users perform depends on an API responding correctly within milliseconds without failing.
When an API slows down or breaks, users don’t see an error message. End users see a spinner that never stops, a form that won’t submit, or an app that crashes. They don’t know it’s an API problem. They just leave.
API monitoring is how engineering teams catch these failures before users do.
What Is an API?
An API (Application Programming Interface) is a set of rules that allows two systems to communicate. When your browser loads a page, it calls APIs to fetch data.
APIs are used in everyday actions like:
- Loading web pages
- Processing payments
- Logging in with services like Google
Modern applications rely on multiple APIs:
- Internal APIs (microservices)
- Third-party APIs
Each API acts as a potential failure point. Because of this, API monitoring is critical to ensure performance and reliability.
What Is API Monitoring?
API monitoring is the continuous process of tracking an API’s availability, response times, error rates, and functional correctness in production, so your team can detect and resolve failures before users are affected.
It works by sending automated requests to your API endpoints at regular intervals, checking whether the responses are correct, fast enough, and returning the right data. When something goes wrong, a timeout, an unexpected error code, or a response that fails validation, your monitoring system alerts the right person immediately.
API monitoring is not the same as API testing. Testing happens before deployment to verify your API works correctly. Monitoring happens continuously after deployment to verify it keeps working correctly under real conditions, with real traffic, over time.
Why API Monitoring Matters
API failures are not infrastructure problems. They are business problems.
API downtime costs enterprises an average of $5,600 per minute. A 100ms increase in API response time reduces conversion rates by 7%. A single failed payment API means lost revenue, not just a failed request. A broken login API at peak traffic means user churn, not just an error log entry.
The teams that catch these failures fastest are the ones with monitoring in place before the failure happens not the ones scrambling to read logs after a user files a support ticket.
Beyond incident response, API monitoring data drives better engineering decisions: which endpoints are slowing down under load, where infrastructure investment will have the most impact, which third-party dependencies are creating reliability risks, and whether a recent deployment introduced a performance regression.
Types of API Monitoring
Not every API needs to be monitored the same way. Different monitoring approaches answer different questions about your API’s health.
1. Uptime Monitoring
Uptime monitoring pings your API endpoints at regular intervals, typically every 1 to 5 minutes, to check whether they respond at all. It is the most basic form of API monitoring and the starting point for every team.
What it detects: complete outages, DNS failures, server crashes, and network issues that prevent the API from responding.
What it misses: slow responses that don’t cross a timeout threshold, incorrect data in responses and partial failures where the API responds but returns wrong results.
When to start: From day one. Every API you run in production should have uptime monitoring before anything else.
2. Performance Monitoring
Performance monitoring measures how quickly your API responds, not just whether it responds. It tracks response time, latency, and throughput continuously, alerting you when performance degrades even if the API is still technically “up.”
A slow API is a failing API from the user’s perspective. A response that takes 8 seconds is not an acceptable response, even if it returns a 200 status code.
What it detects: performance regressions, latency spikes, resource exhaustion and scaling bottlenecks.
Key insight: Never monitor only average response time. An average of 200ms can hide a p99 of 8 seconds, meaning 1 in every 100 users waits 40x longer than your average suggests. Track p50 (median), p95, and p99 latency to understand both the typical experience and the worst-case experience your users actually encounter.
3. Synthetic Monitoring
Synthetic monitoring runs scripted test sequences against your API on a schedule, simulating real user workflows without requiring real users to be present. Instead of just checking “does this endpoint respond,” it checks “does this entire user flow work end to end.”
Example: A synthetic monitor for a checkout API might POST an order, verify the order ID in the response, call the order status endpoint, and confirm the status is “confirmed” all as a single automated sequence.
What it detects: broken multi-step workflows, functional regressions, geographic performance issues (by running checks from multiple locations), problems that only appear in sequence, not in isolation.
Best use: Monitoring business-critical flows, login, payment, signup, core product actions, even during off-peak hours when real users aren’t present to surface issues.
4. Real User Monitoring (RUM)
Real User Monitoring captures how actual users experience your API in production. Instead of simulated checks, it instruments real requests made by real users on real devices and networks.
What it detects: performance issues that only appear under specific conditions, certain devices, certain geographies, certain network types, certain combinations of request parameters that your synthetic tests never hit.
What it misses: issues during low-traffic periods, problems on endpoints that users haven’t visited yet.
The relationship between RUM and synthetic monitoring: Synthetic monitoring is your proactive safety net; it runs even when no users are present. RUM is your production truth it shows what users actually experience. Use both together. Learn more about Real User Monitoring →
5. Validation Monitoring
Validation monitoring goes beyond checking whether an API responds and checks whether it responds correctly. It verifies that response bodies contain the expected fields, data types match the schema, status codes are appropriate, and headers are correct.
What it detects: silent failure situations where an API returns a 200 status code but the response body is empty, malformed, or missing critical fields that your frontend depends on. These are among the hardest bugs to catch without validation monitoring because standard uptime checks see a “successful” response and move on.
6. Security Monitoring
Security monitoring tracks your APIs for signs of malicious activity: unusual spikes in request volume, authentication failures, unexpected geographic access patterns, requests with malformed parameters designed to probe for vulnerabilities, and data exfiltration patterns.
Approximately 35% of businesses reported at least one API security incident in the past year. APIs expose your data to the outside world, making them a primary attack surface.
What to monitor: failed authentication rate, unusual rate patterns, unexpected IP geographies, payload anomalies, and OAuth token misuse.
7. Integration Monitoring
Most APIs don’t work in isolation; they call other services, and those services call others. Integration monitoring tests whether the interactions between your API and its dependencies, third-party services, internal microservices and databases are working correctly end-to-end.
This is especially critical in microservices architectures where a failure in one downstream service can propagate silently through an entire request chain before surfacing as an error to the user.
8. Compliance Monitoring
For APIs that handle regulated data, financial transactions, health records, and personal data covered by GDPR or CCPA compliance, monitoring tracks whether data handling, encryption, access controls, and audit logging are functioning as required. A fast, available API that leaks PII or logs requests incorrectly is still a failing API from a compliance perspective.
API Monitoring vs API Testing: What’s the Difference?
This is the most common point of confusion. Both involve sending requests to APIs and checking responses, but they serve completely different purposes.
| API Testing | API Monitoring | |
| When it runs | Before deployment | Continuously in production |
| Who runs it | Developers and QA teams | DevOps, SRE, platform teams |
| Data source | Synthetic test cases | Real traffic and scheduled checks |
| Environment | Staging or local | Live production |
| Goal | Verify the API works correctly | Verify it keeps working correctly |
| Catches | Bugs before they reach users | Failures and degradations after release |
| Triggered by | A developer or CI/CD pipeline | A scheduler or real user traffic |
The simple way to remember it: Testing asks “does this API work?” Monitoring asks “is this API still working?”
You need both. Testing catches bugs before they ship. Monitoring catches failures after they ship. An API that passed every test can still fail in production due to infrastructure issues, traffic spikes, third-party dependencies, or configuration drift.
Key API Metrics to Monitor
Availability (Uptime)
Availability measures the percentage of time your API is operational and responding to requests. Expressed as a percentage over a measurement period.
Formula: (Total uptime ÷ Total monitoring period) × 100
Good threshold: 99.9% uptime (“three nines”) means approximately 8.7 hours of downtime per year. 99.99% (“four nines”) means approximately 52 minutes per year. Most SLAs specify which level is required your monitoring data is how you prove you are meeting it.
Response Time and Latency (p50, p95, p99)
Response time measures how long it takes for your API to process a request and return a response. Always measure it at multiple percentiles:
| Percentile | What It Means | Why It Matters |
| p50 (median) | Half of requests are faster than this | The typical user experience |
| p95 | 95% of requests are faster than this | The experience for most users |
| p99 | 99% of requests are faster than this | The worst-case experience for 1 in 100 users |
| p99.9 | 999 of every 1000 requests are faster | Used for high-stakes SLAs |
A p50 of 120ms looks healthy. If your p99 is 6 seconds, 1% of your users potentially thousands per day are experiencing a broken product.
Good baseline thresholds:
- Simple GET requests: p95 under 300ms
- Complex queries or write operations: p95 under 1 second
- Any endpoint: p99 should not be more than 3–5x your p50
Error Rate
Error rate is the percentage of API requests that result in errors typically 4xx (client errors) or 5xx (server errors).
Formula: (Failed requests ÷ Total requests) × 100
Not all error codes are equal. A 404 on an optional endpoint is different from a 500 on your payment endpoint. Set error rate alerts by endpoint and error type, not just globally a high global error rate may be masking a critical failure on one specific endpoint.
What high error rates indicate:
- 4xx: Incorrect client requests, authentication failures, rate limiting, validation issues
- 5xx: Server failures, database errors, unhandled exceptions, dependency failures, resource exhaustion
Throughput (Requests Per Second)
Throughput measures how many requests your API processes per unit of time. Sudden drops in throughput (when traffic is expected) can indicate failures or cascading errors. Sudden spikes can indicate a traffic surge, a retry storm, or a security attack.
CPU and Memory Usage
Resource metrics tell you whether your API is being constrained by the underlying infrastructure. High CPU usage causes increased latency. Memory leaks cause gradual degradation over time. These metrics connect your API performance data to the infrastructure layer, allowing you to distinguish between an application bug and a capacity issue.
Service Level Objectives (SLOs) and SLAs
An SLO is your internal target: for example, 99.9% uptime and p95 response time under 300ms. An SLA is a contractual commitment to a customer or partner with financial consequences for breach.
API monitoring provides the continuous data that tells you whether you are meeting SLOs before you breach an SLA. Without monitoring, you discover SLA violations when your customers tell you not before.
Error rate is the percentage of API requests that result in errors typically 4xx (client errors) or 5xx (server errors).
Formula: (Failed requests ÷ Total requests) × 100
Not all error codes are equal. A 404 on an optional endpoint is different from a 500 on your payment endpoint. Set error rate alerts by endpoint and error type, not just globally a high global error rate may be masking a critical failure on one specific endpoint.
What high error rates indicate:
- 4xx: Incorrect client requests, authentication failures, rate limiting, validation issues
- 5xx: Server failures, database errors, unhandled exceptions, dependency failures, resource exhaustion
Learn more about API metrics and how to track them effectively in our detailed guide on API Metrics.
How API Monitoring Works: Step by Step
Step 1: Send automated requests
Your monitoring system sends HTTP requests to your API endpoints at regular intervals, typically GET, POST, PUT, or DELETE requests matching the method your endpoint expects. The frequency ranges from every 30 seconds for critical endpoints to every 5 minutes for lower-priority checks.
Step 2: Check the response
The monitoring system validates:
- Status code: Did the API return the expected HTTP status code?
- Response time: Did it respond within your defined latency threshold?
- Response body: Does the body contain the expected fields and data types?
- Are the headers the correct headers present?
Step 3: Detect failures
If any check fails with an incorrect status code, the response is too slow, body validation fails, or there is no response at all, the monitoring system records a failure event and begins the alert process.
Step 4: Alert the right person
A well-configured alerting system doesn’t just send an email. It routes the right alert to the right person through the right channel: on-call engineers via PagerDuty or OpsGenie, team channels via Slack or Microsoft Teams, and incident management platforms for coordinated response. Alerts that nobody sees are not alerts.
Step 5: Diagnose and resolve
When an alert fires, your team needs more than “the API is slow.” Connected observability data traces that show the full request path through your services, logs that show what happened at each step, and infrastructure metrics that show resource utilization collapse the gap between detecting a failure and finding its root cause.
Step 6: Track trends and improve
Beyond incident response, API monitoring data accumulates into trends that show whether performance is degrading gradually, whether specific endpoints are becoming slower over time, and whether your error rate is creeping up week over week. This data drives proactive optimization, fixing problems before they become incidents.
How to Monitor APIs You Don’t Control
Third-party APIs are one of the most overlooked risks in modern applications. Your application may depend on a payment processor, an email delivery service, a mapping API, an authentication provider, or a data enrichment service, and you have no visibility into their internal operations.
What you can do:
Monitor from the outside. Set up your own synthetic checks against third-party endpoints you depend on. You won’t see their internal metrics, but you will know when they stop responding or slow down from your users’ perspective.
Track response times from your own infrastructure. Instrument the calls your application makes to third-party APIs. A spike in outbound API latency from your system, even when your own infrastructure is healthy, points to the third-party as the source of the issue.
Subscribe to vendor status pages. Most major APIs maintain public status pages. Subscribe to their incident updates, but don’t rely on them alone. Vendors sometimes update status pages after incidents have already affected users.
Set circuit breakers. At the code level, implement circuit breakers on third-party API calls so that when a dependency fails, your application degrades gracefully rather than cascading the failure to your users.
API Monitoring Best Practices
Start with your most critical endpoints. Not every API needs the same monitoring depth. Map your endpoints to business impact first: checkout, login, core product functionality and start there. You can expand coverage as your monitoring matures.
Set baselines before setting thresholds. Run your monitoring for one week before configuring alert thresholds. Alert on deviation from your real baseline, not a number you guessed. Alerting on p95 > 300ms on an endpoint with a real p95 of 800ms means your first alert fires before you’ve even launched.
Monitor from multiple geographic locations. An API that responds in 80ms from your US servers may respond in 1.2 seconds for users in Southeast Asia due to routing and CDN configuration. Multi-location monitoring automatically surfaces these regional issues.
Use p95 and p99 for latency alerts, not averages. Averages hide tail latency. Alert on the percentiles that represent real user experiences, especially for endpoints on critical user journeys.
Separate your alert routing by severity. A 404 on a documentation endpoint does not need to wake up an on-call engineer at 3 am. A 500 on your payment endpoint does. Define severity levels for each endpoint and route alerts accordingly.
Include assertion checks, not just status code checks. A 200 response that returns an empty array is a silent failure that a status code check will never catch. Add response-body validation checks for expected fields, correct data types, and non-empty collections where your application requires data.
Correlate API monitoring with traces and logs. An alert that tells you an API is slow is only half the information you need. When your API monitoring is integrated with distributed tracing and log management, you can trace the slow request through your backend, identify the slow service, and review the relevant logs without switching tools.
Review your monitoring coverage after every new deployment. New endpoints, changed response schemas, and new dependencies need to be added to your monitoring configuration. Treat monitoring coverage as part of your deployment checklist.
API Monitoring with Middleware
Middleware provides full-stack API monitoring as part of its unified observability platform, covering uptime checks, performance tracking, synthetic monitoring, error tracing, and distributed trace correlation in a single interface.
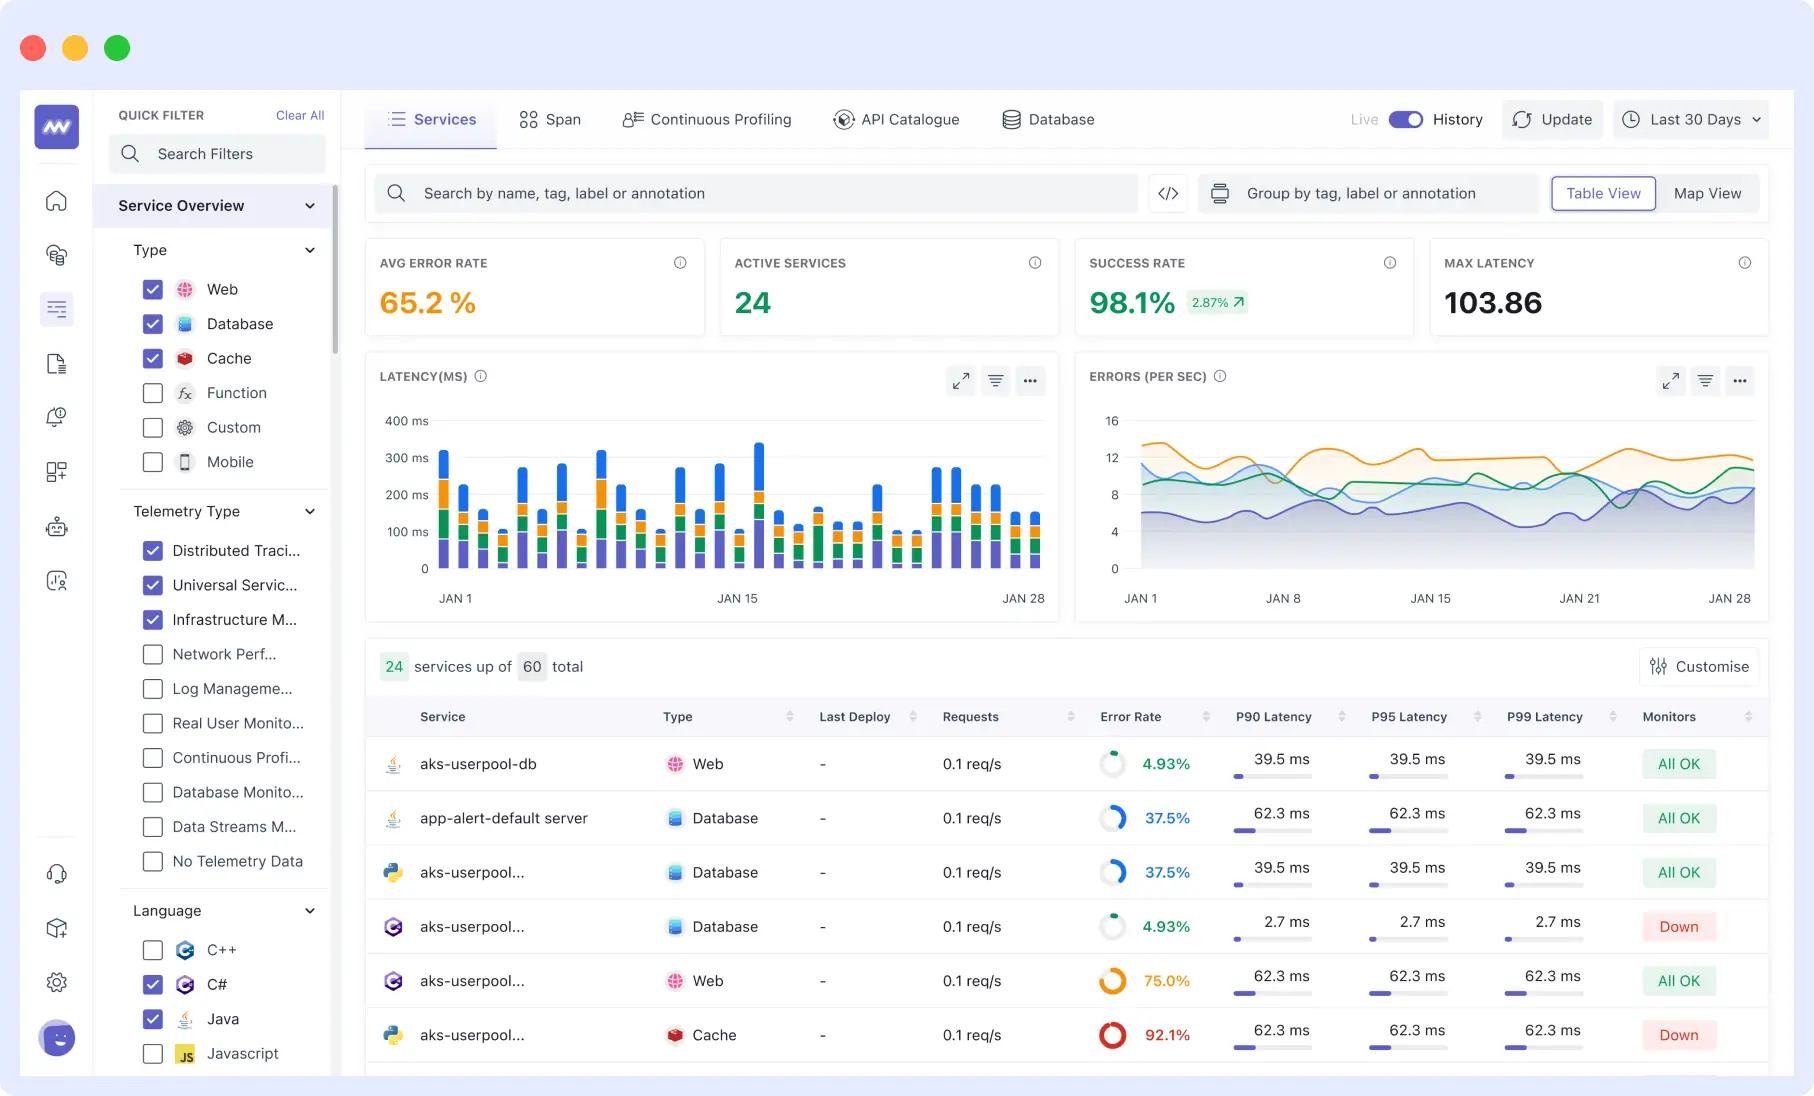
When an API alert fires in Middleware, your team can immediately follow the trace from the failing endpoint through every backend service it touched, read the associated logs, and check infrastructure metrics for the affected host without leaving the platform.

Middleware supports both single-endpoint health checks and multi-step synthetic monitors for complex API flows. Alerts route to Slack, Microsoft Teams, PagerDuty, OpsGenie, or email. The platform is OTel-native, meaning your existing OpenTelemetry instrumentation works without modification.
For a full comparison of API monitoring tools, including open-source and commercial options, see: Best API Monitoring Tools in 2026 →
Middleware offers a free tier with 100 GB of data ingestion per month. Pay-as-you-go pricing starts at $0.30/GB.
Final Thoughts
API monitoring is not optional for teams running production systems. Every API your users depend on is a potential point of failure, and without monitoring, the first person to know about a failure is usually a user, not your team.
The starting point is simple: uptime checks on your critical endpoints. From there, add latency monitoring at p95 and p99, endpoint-level error rate tracking, response validation, and multi-step synthetic monitors for your most important user flows. Connect that monitoring data to distributed traces and logs so that when an alert fires, your team has everything they need to diagnose the root cause, not just the symptom.
The teams that fix API failures fastest are not the ones with the most engineers. They are the ones with the most visibility.
Ready to start monitoring your APIs? Middleware provides full-stack API monitoring with a free tier, no credit card required. Get started free →
FAQs
What is API monitoring?
API monitoring is the continuous process of tracking an API’s availability, response time, error rate, and functional correctness in production. It works by sending automated requests to API endpoints at regular intervals and alerting engineering teams when responses are slow, incorrect, or absent. The goal is to detect and resolve API failures before users are affected.
What is the difference between API monitoring and API testing?
API testing runs before deployment to verify an API works correctly it’s a quality assurance step performed by developers and QA teams. API monitoring runs continuously in production to verify the API keeps working correctly over time, under real traffic, with real dependencies. Testing catches bugs before release. Monitoring catches failures after release. You need both.
What is a good API response time?
For most web applications, a p95 response time under 300ms is considered good for simple GET requests. For complex queries or write operations, p95 under 1 second is a reasonable target. The more important number is your p99 it should not be more than 3–5x your p50 (median). An average of 200ms with a p99 of 6 seconds means 1% of your users are experiencing a broken experience, regardless of what your average shows.
What does p50, p95, and p99 mean in API monitoring?
These are latency percentiles. p50 (the median) means 50% of requests are faster than that value it represents the typical user experience. p95 means 95% of requests are faster it captures most users. p99 means 99% of requests are faster it captures almost all users including worst-case experiences. Monitoring averages alone hides the tail latency that affects a significant portion of real users.
How do I monitor a third-party API I don't control?
Set up synthetic checks against the third-party endpoints your application depends on you won’t see their internal metrics, but you’ll detect failures from your users’ perspective. Also instrument the outbound calls your application makes to third-party services and track their response times from your own infrastructure. Subscribe to the vendor’s public status page for incident updates, but treat that as a supplement to your own monitoring, not a replacement.
What causes API downtime?
The most common causes are: infrastructure failures (server crashes, network issues, database outages), deployment errors that introduce bugs or breaking changes, dependency failures where a downstream service your API relies on goes down, traffic spikes that exceed capacity, memory leaks causing gradual performance degradation, and security incidents like DDoS attacks that overwhelm the API. Monitoring each of these layers not just the API endpoint itself gives you the fastest path to root cause when something fails.
What is API rate limiting and should I monitor it?
Rate limiting restricts how many requests a client can make to an API within a time window. Monitoring rate limiting matters in two directions: for APIs you control, track how often clients are hitting your rate limits (a sign they need higher limits or you need to optimize their usage patterns). For third-party APIs you consume, monitor for 429 (Too Many Requests) responses these indicate you’re being throttled, which can silently degrade your application’s functionality without triggering standard error rate alerts.
What is the difference between API latency and API response time?
Latency refers specifically to the network transit time how long it takes for the request to travel from the client to the server. Response time is the full end-to-end measurement: from when the client sends the request to when it receives the complete response, including network latency, server processing time, and data transfer time. In practice, most API monitoring tools report end-to-end response time. Latency in isolation is more relevant for network-level diagnosis.
What should I do when an API monitoring alert fires?
First, confirm the failure is real check whether your monitoring is firing from multiple geographic locations or just one (a single-location failure may indicate a network issue, not an API failure). Then check whether the issue is isolated to one endpoint or affecting multiple (broad failures point to infrastructure; isolated failures point to application-level bugs or deployment changes). Pull the associated traces and logs for the failing endpoint to find where time is being spent or where errors are originating. Check whether a recent deployment correlates with the start of the failure. Escalate based on the business impact of the affected endpoint.
Leave a Reply