Tag: Monitoring
-
Docker Status: How to Check If Docker Is Down and Fix Common Errors
Docker status isn’t one thing. When a container looks off, you’re never sure whether to check the daemon, the container itself, or the app running inside it, and there’s no single docker status command that just tells you. This guide gives you the exact command for each of the three status types, so you can find what’s…
-
Top 10 Dynatrace alternatives in 2026
Dynatrace is a dominant observability platform, but growing teams are finding it increasingly difficult to justify its complexity, opaque DDU-based pricing, and steep learning curve. Whether you are scaling a cloud-native startup, modernizing a mid-size SaaS product, or a large enterprise rethinking vendor lock-in, there is a wide field of capable Dynatrace alternatives that offer…
-
10 Best Coralogix Alternatives in 2026: Features, Pricing & OTel Support Compared
Looking for the best Coralogix alternatives? Coralogix is a powerful observability platform, but its proprietary DataPrime query language, cloud egress costs, and learning curve lead many teams to explore other options. In this guide, we compare the best Coralogix alternatives based on OpenTelemetry support, pricing, deployment models, and key features to help you choose the…
-
AI SRE Agent for On-Call Engineers: How OpsAI Cuts MTTR From Hours to Minutes
On-call engineering is one of the hardest knowledge-transfer problems in software, and most AI SRE agent for on-call engineers conversations start in the wrong place. A junior engineer inherits a production system at 2 AM with a P1 alert firing. They have no context for why the service behaves the way it does. Traditional runbooks…
-
12 Best Log Management Tools in 2026 (Compared)
Summary: We evaluated 12 log management tools from unified observability platforms like Middleware and Datadog to open-source options like Grafana Loki and the ELK Stack across pricing, OpenTelemetry support, Kubernetes-native logging, and AI-assisted analysis. Pricing ranges from free self-hosted setups to usage-based plans running into five figures a month at scale. No single tool wins…
-
What Is Jaeger Tracing? A Beginner’s Guide to Distributed Tracing
Summary: Jaeger tracing is an open-source distributed tracing system that helps track requests as they move across multiple services. It collects trace data through OpenTelemetry, stores it in a supported backend, and provides a UI for searching and visualizing traces. Jaeger tracing helps engineers identify latency issues, service failures, and performance bottlenecks in distributed systems.…
-
Bring AI inference into your full-stack observability with the TrueFoundry AI Gateway integration
Getting AI models into production is one challenge. Knowing what they do once they’re there is another. Every inference request carries information you need: latency, token usage, model behavior, finish reason. But wiring observability into each model and provider usually means repetitive, custom instrumentation for every integration. We built Middleware to remove that work. With…
-
10 Best Synthetic Monitoring Tools in 2026 (Reviewed and Compared)
Synthetic monitoring is the practice of using scripted bots to simulate user interactions, including page loads, login flows, API calls, and checkout transactions, at scheduled intervals from real geographic locations. It runs 24/7 without requiring real user traffic, so your team can catch failures before customers ever encounter them. Synthetic monitoring and testing tools are the…
-
New Relic vs Sentry: Full Comparison for 2026
New Relic and Sentry both monitor production software, but they solve different problems. New Relic covers apps, infrastructure, logs, browsers, mobile, Kubernetes, and synthetics on a single platform. It also includes APM and distributed tracing. Sentry started as an error tracker for developers and has since expanded to include APM, logs, and session replay, but…
-
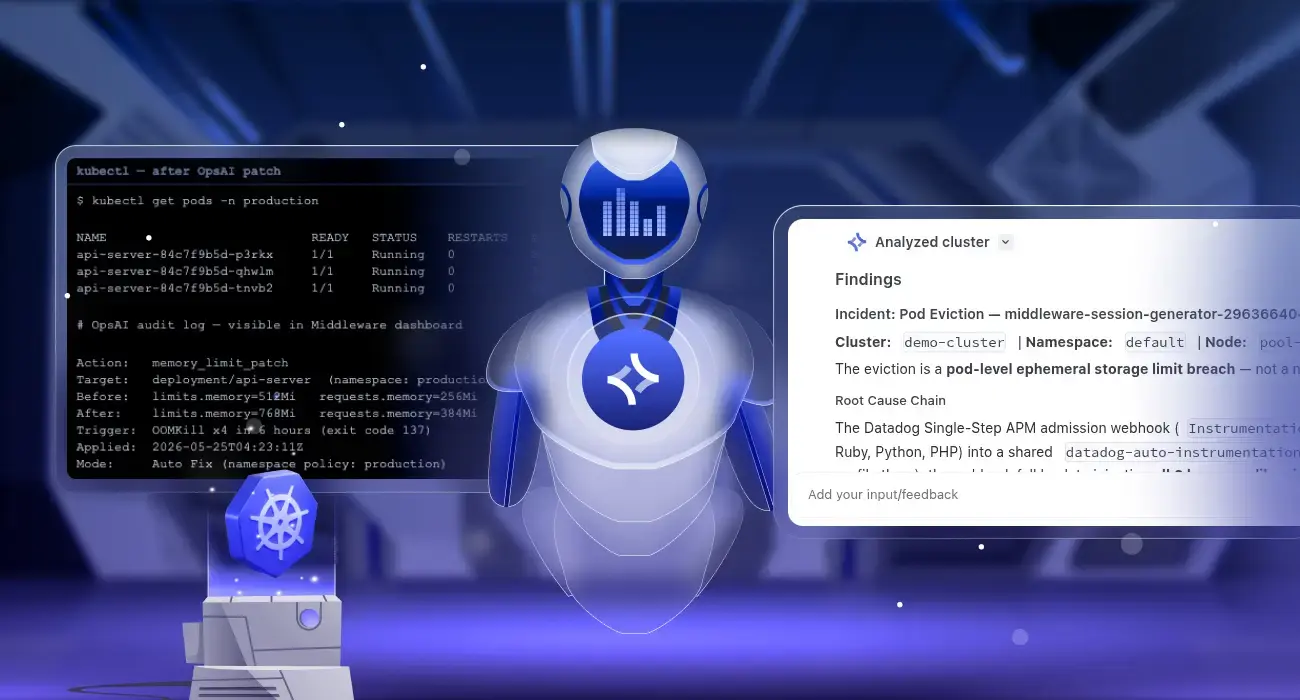
Kubernetes Self-Healing: Automatic Pod Crash Remediation with OpsAI
Kubernetes pod crash auto-remediation is the ability to automatically detect why a pod crashed and apply a permanent fix without human intervention. Middleware OpsAI does this by monitoring Kubernetes events, pod metrics, and container logs in real time, diagnosing the root cause of each failure, and patching the cluster directly, for example, raising a memory…
-
How We Built an AI SRE Agent That Troubleshoots Production Issues Like a Team of Engineers
We built OpsAI because investigating a production incident has become one of the hardest cognitive tasks in software engineering, and the industry’s answer has been to add more dashboards. That’s the wrong answer. As distributed environments grow, the signals get noisier, failures span more systems, and Kubernetes adds layers that nobody fully understands at 3…
-
Logging vs Monitoring: What’s the Difference?
TL;DR: Logging records what happened inside your system. Monitoring watches whether your system is healthy right now. They answer different questions, and neither replaces the other. Logging and monitoring are two of the most commonly used terms in DevOps and engineering, often mentioned together, but they are not the same thing and do not do…