Tag: Monitoring
-
Dynatrace vs. New Relic: The Full 2026 Comparison Guide
Choosing between Dynatrace vs New Relic usually comes down to one trade-off: automated depth or flexible breadth. Your app is slow, an alert just fired, and you need to know if it’s the database, the network, or a bad deploy before your users do. This guide compares both platforms across infrastructure monitoring, APM, logs, pricing,…
-
How to Upload Source Maps for Real User Monitoring So Stack Traces Aren’t Minified
Source maps are JSON files that map your minified, bundled JavaScript back to the original file and line number you wrote. Real User Monitoring (RUM) tools use them to turn a.js:1:48213 into checkout/validateCard.ts:42. This guide covers why minified traces show up, how upload-and-match works, and how to automate it in CI/CD. The real challenge isn’t…
-
Incident Correlation: How to Automatically Group Related Alerts From the Same Root Cause
Incident correlation automatically links alerts, logs, traces, and metrics from the same failure into one incident, instead of paging on each signal separately. This article covers how correlation works, the main grouping techniques, and how to apply them when one outage floods your on-call channel with dozens of alerts. The core trade-off is speed versus…
-
OpenTracing vs. OpenTelemetry: Key Differences and Migration Guide
If you searched for opentracing vs opentelemetry because your instrumentation still imports an OpenTracing library, you are looking at a dependency that CNCF archived years ago. This guide lays out what actually changed between the two projects, why the switch matters for your traces today, and a concrete path to move your services onto OpenTelemetry…
-
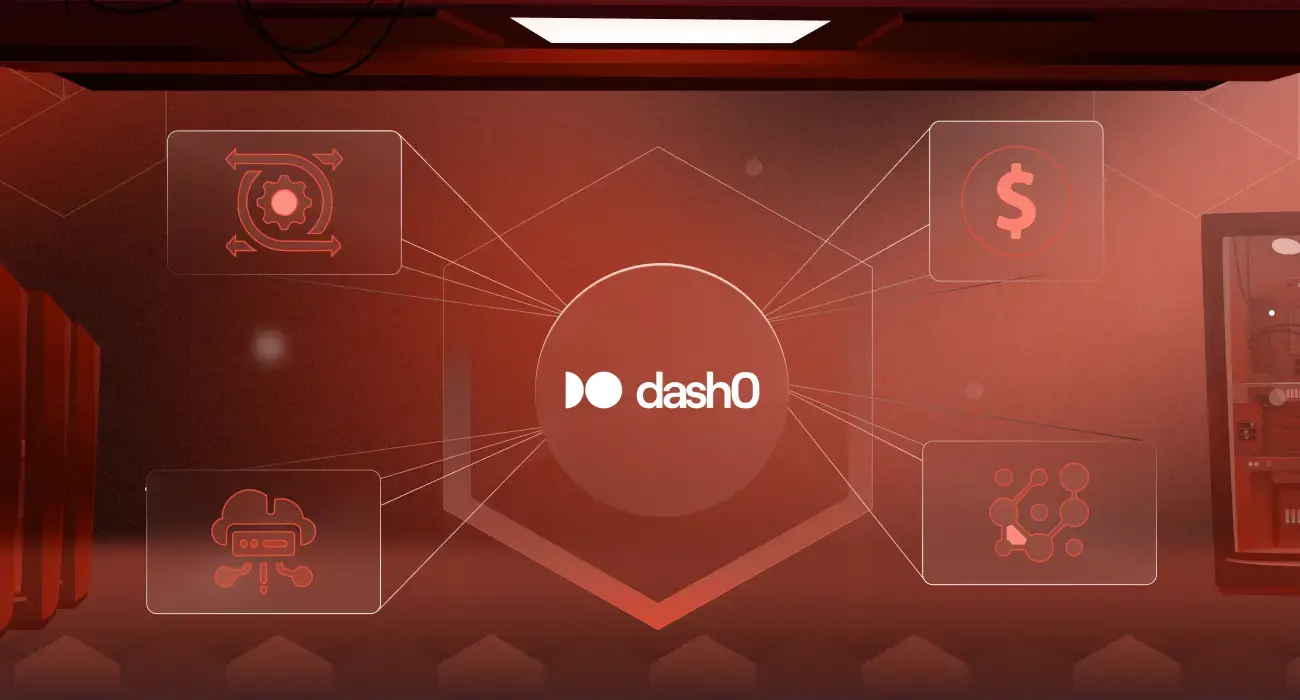
10 Best Dash0 Alternatives in 2026: Features, Pricing & OTel Support Compared
Looking for Dash0 alternatives usually means you’ve hit one of three walls: Agent0 is still in Beta, there’s no on-call or incident management built in, or you need a self-hosting path Dash0’s SaaS-only model doesn’t offer. This guide compares 10 platforms, including Middleware, Datadog, and SigNoz, across OpenTelemetry support, pricing, and free tiers, so you…
-
Sentry Pricing 2026: Full Cost Breakdown by Plan & Team Size
Sentry bills differently than most observability platforms: instead of metering data volume, it meters events, errors, spans, replays, logs, and attachments each with its own quota and its own overage rate. Overages on the Team plan run from $0.0003625 per error in the 50k–100k tier down to $0.0001500 per error at 20M+ events, while Business…
-
AWS Lambda CloudFormation: How to Create, Deploy, and Manage Lambda Functions
AWS Lambda runs your function code, while AWS CloudFormation defines and manages the function and its related resources, including IAM roles, triggers, and environment variables. This guide explains how to create, deploy, update, troubleshoot, and monitor a Lambda function with CloudFormation. See your Lambda functions the moment they deploy Get invocations, errors, and cold starts…
-
AWS Fargate vs. Lambda: 6 Differences and How to Choose
Choosing between AWS Fargate and AWS Lambda usually comes down to one question: do you need to run a container, or just a function? Fargate runs your existing container images without you touching an EC2 instance. Lambda runs short bursts of code with no container involved at all. Match the compute to the workload and…
-
Middleware Expands Subscription Options With Google Marketplace Availability
Middleware is now available on Google Cloud Marketplace, giving Google Cloud customers a new way to subscribe: directly from your GCP console, billed through your existing Google Cloud invoice, with eligible spend counting toward your committed Google Cloud spend. Deployment doesn’t change. It’s the same OpenTelemetry agent, the same GKE install, and the same native…
-
Auto-Fixing API Errors Before They Hit Users: How OpsAI Correlates APM Traces and Frontend Sessions
A payment API times out, a checkout throws a 500, and your dashboards stay green the whole time. That’s not a monitoring gap, it’s a structural one: backend alerting only sees aggregate metrics, not what a single user just experienced in their browser. Middleware OpsAI closes that gap by correlating APM traces with RUM sessions…
-
Building Effective Alert Correlation Strategies for Distributed Microservices
Alert correlation is what turns 47 simultaneous Kubernetes alerts into one clear incident instead of an all-night scavenger hunt. In distributed microservices, a single upstream failure cascades into dozens of alerts that all look independent, and all demand attention at once. Without a way to group them by cause, your team burns hours chasing symptoms…
-
Docker Status: How to Check If Docker Is Down and Fix Common Errors
Docker status isn’t one thing. When a container looks off, you’re never sure whether to check the daemon, the container itself, or the app running inside it, and there’s no single docker status command that just tells you. This guide gives you the exact command for each of the three status types, so you can find what’s…
