Category: Knowledge
-
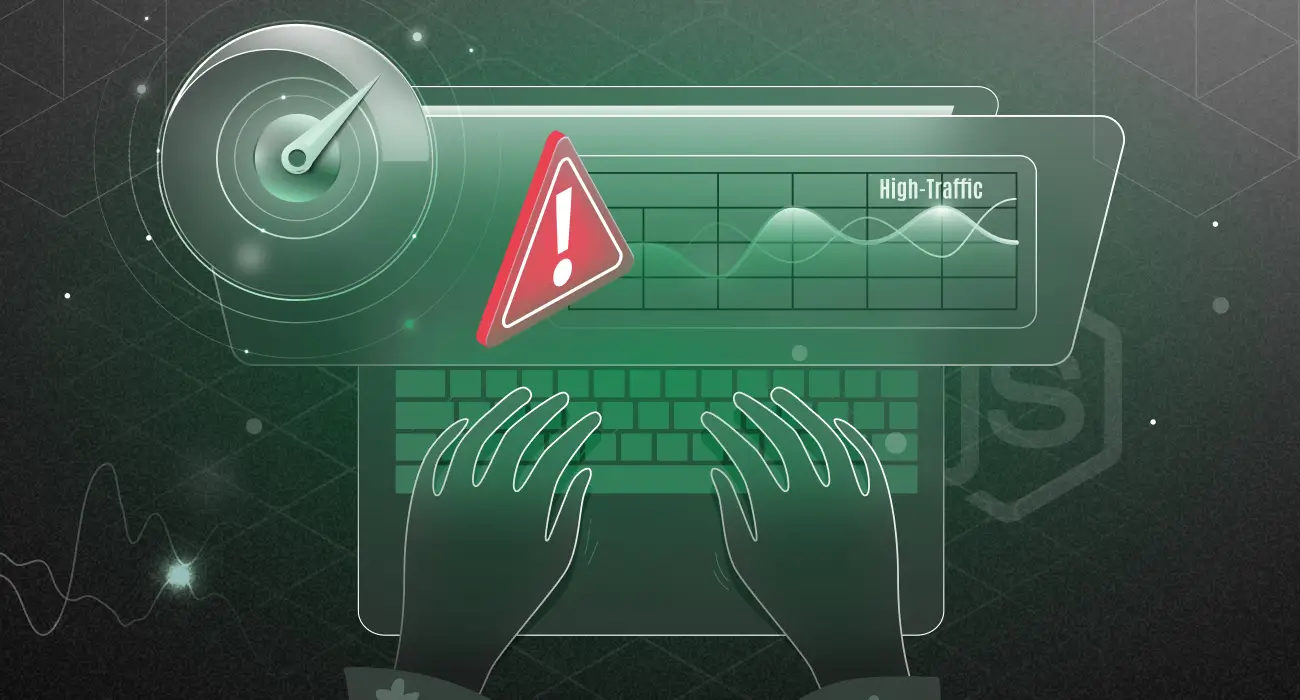
Reducing Error Rates in a High-Traffic Node.js App Using APM
Is your Node.js app crashing under high traffic? Middleware APM helps you detect and fix performance issues in real-time before users notice. Stay fast, stable, and scalable with smart monitoring and auto-remediation.
-
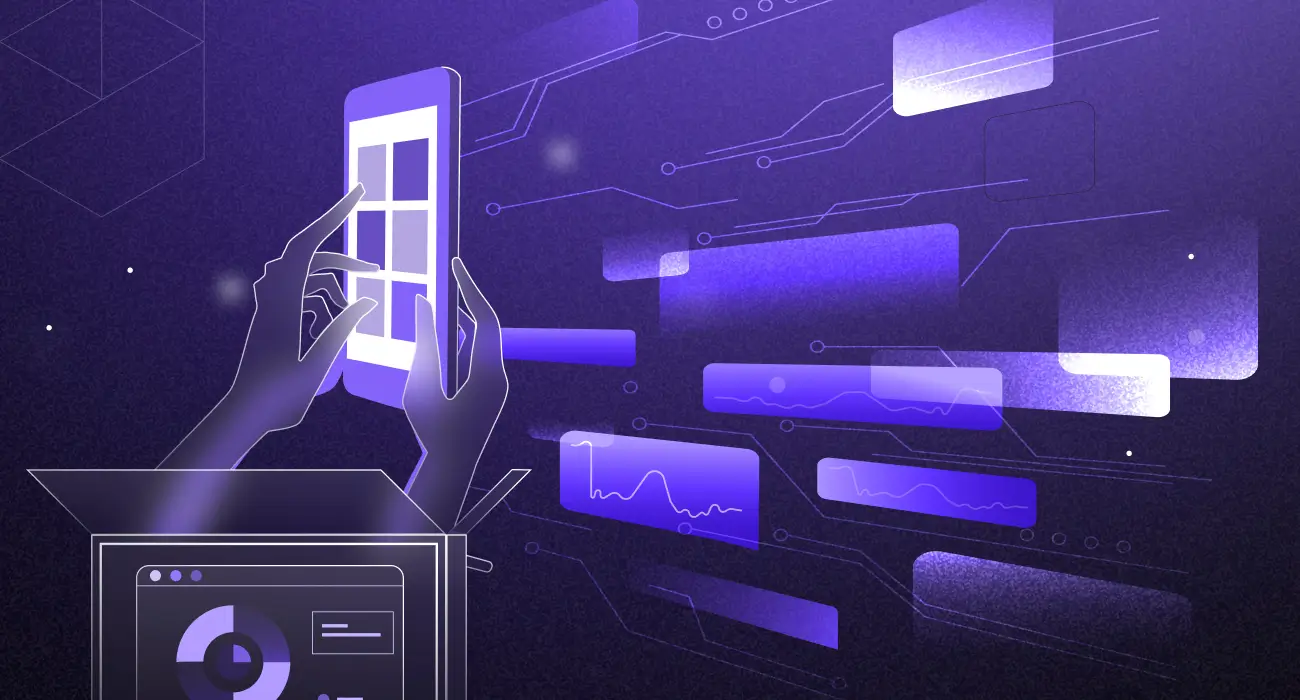
How Digital Experience Monitoring Transforms User Journeys Across Web & Mobile
You know how frustrating it can be when you try to use a web or mobile app and see that the pages aren’t responding or something isn’t working as it should. When users face delays or errors in your web or mobile app, especially during purchases or financial transactions, it damages trust and leads to…
-
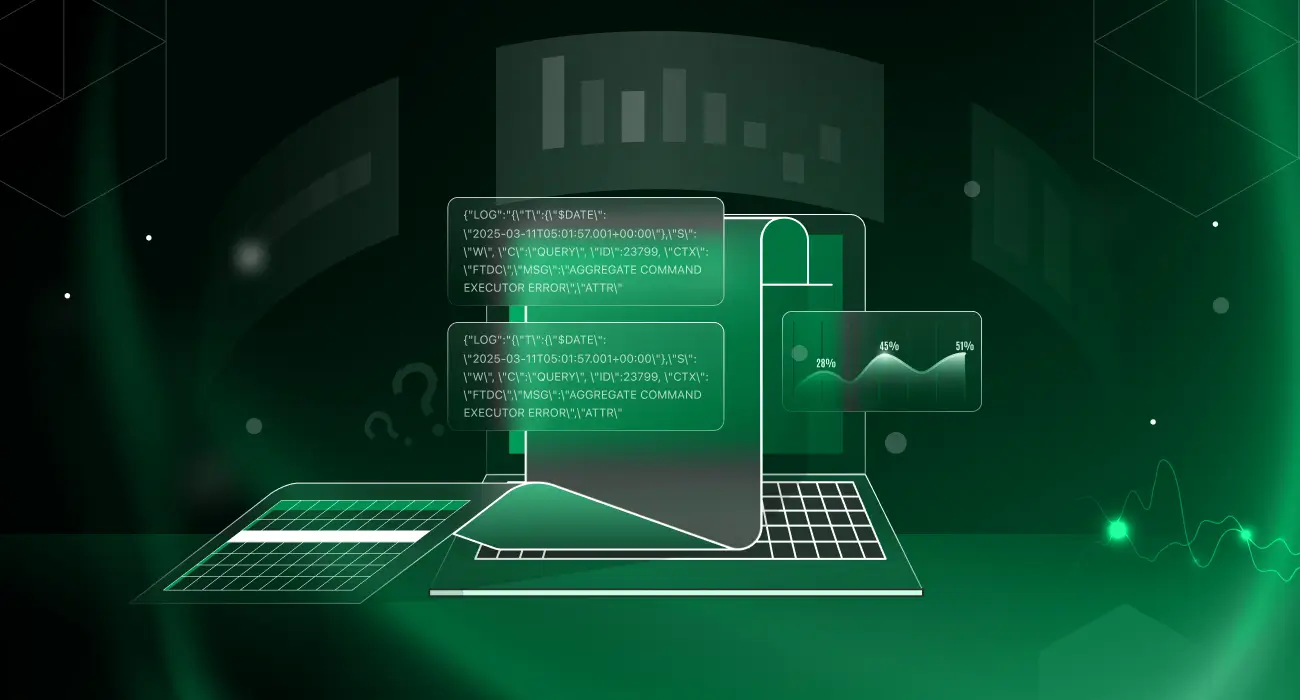
How Log Patterns Help You Debug Faster and Monitor Smarter
Logs are everywhere; every click, each request, all the small things your app or website ever does leaves a trace. And when something’s broken? Sorting through page after page of raw data trying to identify what’s normal (and what’s not) is like searching for a needle in a haystack. That’s where log pattern detection helps.…
-
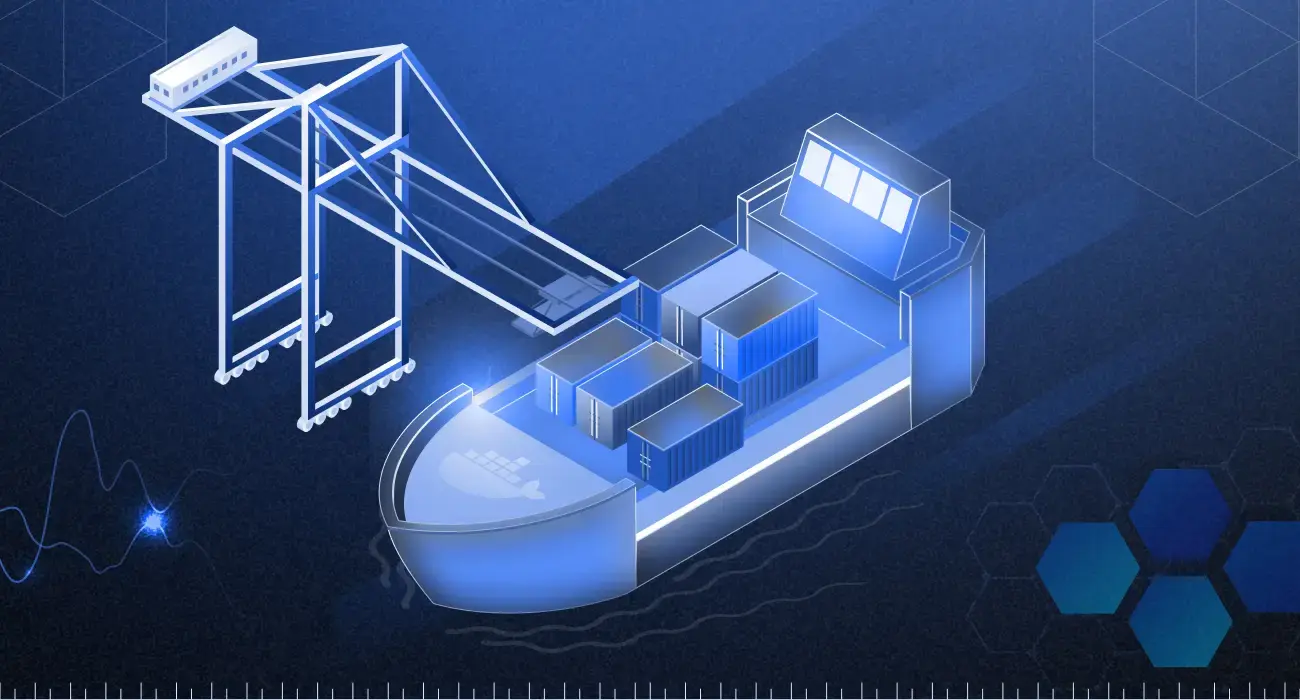
How to Manage Docker Container Logs for Monitoring & Troubleshooting
Learn how to manage Docker container logs effectively to streamline monitoring, troubleshoot issues faster, and optimize application performance.
-
Why Developers Fear Memory Leaks? And How Can Beat them easily.
Imagine a scenario where you have limited resources, but a single program takes up more memory than it should, even if it’s not using it. That’s what a memory leak is all about. You need to identify and prevent these leaks early, or else the program will slowly use up all available memory on your…
-
How to Use Prometheus Pod Monitor for Pod-Level Metrics Collection
In Kubernetes, everything runs inside pods. Instead of dealing with containers one by one, Kubernetes uses pods to group them together and manage them more easily. That’s why monitoring pods is so important. You need to know if your apps are running smoothly and how much CPU or memory they’re using. That’s where Prometheus comes…
-
A Comprehensive Guide to Latency Reduction and Performance Optimization
Find out the best ways to reduce latency in order to improve the performance of applications, networks, databases, and infrastructure.
-
Windows Server Monitoring: Challenges, Tools, & Best Practices
Imagine this: It’s a Monday morning, your eCommerce site is about to launch a big flash sale, and thousands of users have started logging in for the sale. But suddenly, your checkout service page crashed. Whom to blame in this situation? Upon investigation, you found out that a memory leak in one of your Windows…
-

Prometheus Labels: Understanding and Best Practices
In observability, Prometheus is a well-known tool amongst SREs and engineers alike. What makes Prometheus so effective is the labels Prometheus implements, which provide context to its metrics and facilitate operations such as filtering and aggregations. New to Prometheus? Learn how it works and why it’s critical for observability in our beginner-friendly guide. By the…
-
10 Best Infrastructure Monitoring Tools of 2026
When a server goes down, a node runs out of memory, or a network issue starts affecting users, the last thing you want is to find out from a support ticket. But if you have enabled Infrastructure monitoring tools, it would be easy for you to gain visibility into what is actually happening across your…
-
Understanding API Metrics: What to Monitor in Your API
APIs have significantly changed the way modern software applications are developed. They allow communication and transfer of information between different systems. As many organizations now adopt the API-first design, developers, DevOps, and Product teams need to understand how APIs work. Measuring these APIs’ performance is an important thing to consider because it helps assess their…
-
Mastering Python Logging Format: A Complete Guide for Developers
Python logging is an in-built module by which programmers can log messages regarding what their program is doing. Storing these messages (or logs) makes it easier to observe how the program works and any issues it has. How you format these logs is important because it affects how the messages are organized and presented. This…