If you’ve been on call long enough, you’ve lived this exact moment: checkout’s p99 jumps, nothing else looks wrong, and you’re staring at three separate tools trying to figure out which one is lying to you.
Years of on-call rotations across enough companies teach the same application monitoring best practices, usually the hard way, usually at 2 AM. What follows are 15 of them, in the order they actually matter during a real investigation, not the order a table of contents would put them in. Each one is a mistake enough engineers have made that it stopped being a coincidence and started being a pattern.
TL;DR
- Monitor critical transactions, track p95 and p99 latency, use distributed tracing, correlate telemetry, alert on user impact, and control telemetry volume.
- p95 and p99 show slow requests that an average hides.
- Distributed tracing finds latency and errors across services, databases, queues, and outside APIs.
- Connecting metrics, traces, logs, database data, and deployment events beats checking each one alone.
- Failed transactions, error rates, SLO burn, and steady latency matter more than one-off CPU or memory spikes.
- Trace sampling and limited metric labels keep useful debugging data without high storage cost.
15 lessons in application monitoring
Lesson 1: the metric that pages you is rarely the one that explains anything
Here’s a pattern every experienced engineer recognizes: CPU is fine, memory is fine, every health check is green, and customers are still stuck on a spinner. The instinct is to distrust the complaint. Don’t. What’s actually happening is that you’re measuring the wrong thing.
The fix isn’t a better dashboard. It’s picking the right transactions to watch in the first place: checkout, payment, login, search, report generation, data ingestion, and tracking whether they succeed, not whether they respond.
A payment endpoint returning a 200 while the charge silently fails behind it is the single most common false sense of security in production monitoring. Track outcomes instead, like payment_success, order_completed, or inventory_reserved, because these show what actually happened.
Attach an error budget to it while you’re there. An SLO (service level objective) is a target for how reliable a service should be, and a 99.9% SLO leaves a 0.1% error budget. Watching how fast that budget burns during an incident tells you more about urgency than any static threshold ever will. This is the core problem application performance monitoring exists to solve: separating what a service is doing from what it should be doing.
Lesson 2: the average is lying to you
Every team eventually gets burned by the same chart: average latency looking perfectly healthy while a real slice of users has a miserable experience. An API can average 230ms while its slowest 1% of requests, its p99, take 2.7 seconds.
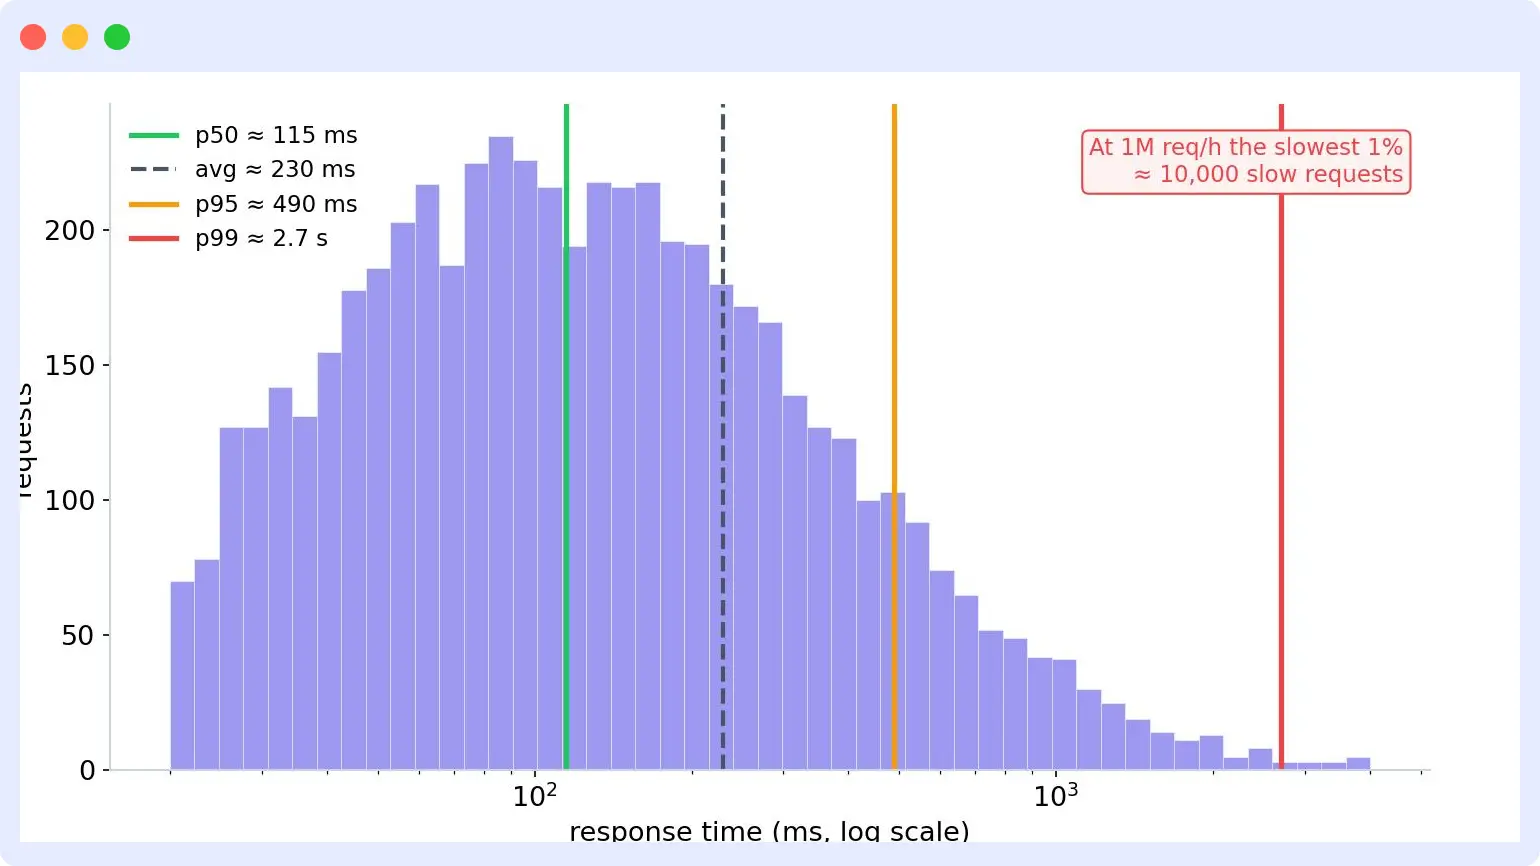
| Metric | Response time |
|---|---|
| Average | 230 ms |
| p50 | 115 ms |
| p95 | 490 ms |
| p99 | 2.7 s |
At one million requests per hour, that slowest 1% is roughly 10,000 requests, not a rounding error. Track p95 and p99 for your important routes, and compare them against traffic and error rates; latency rising with a traffic surge is a different problem than the same rise under normal load.
Here’s the trap within the trap: fast failures lower your average while reliability quietly gets worse. Always separate successful requests from failed ones before you trust what the average is telling you.
Lesson 3: don’t trust a service dashboard until you’ve seen the trace
A metric tells you performance changed. It never tells you where. That’s what distributed tracing is for, and it’s usually the first tool an experienced engineer reaches for once the dashboards run out of answers.
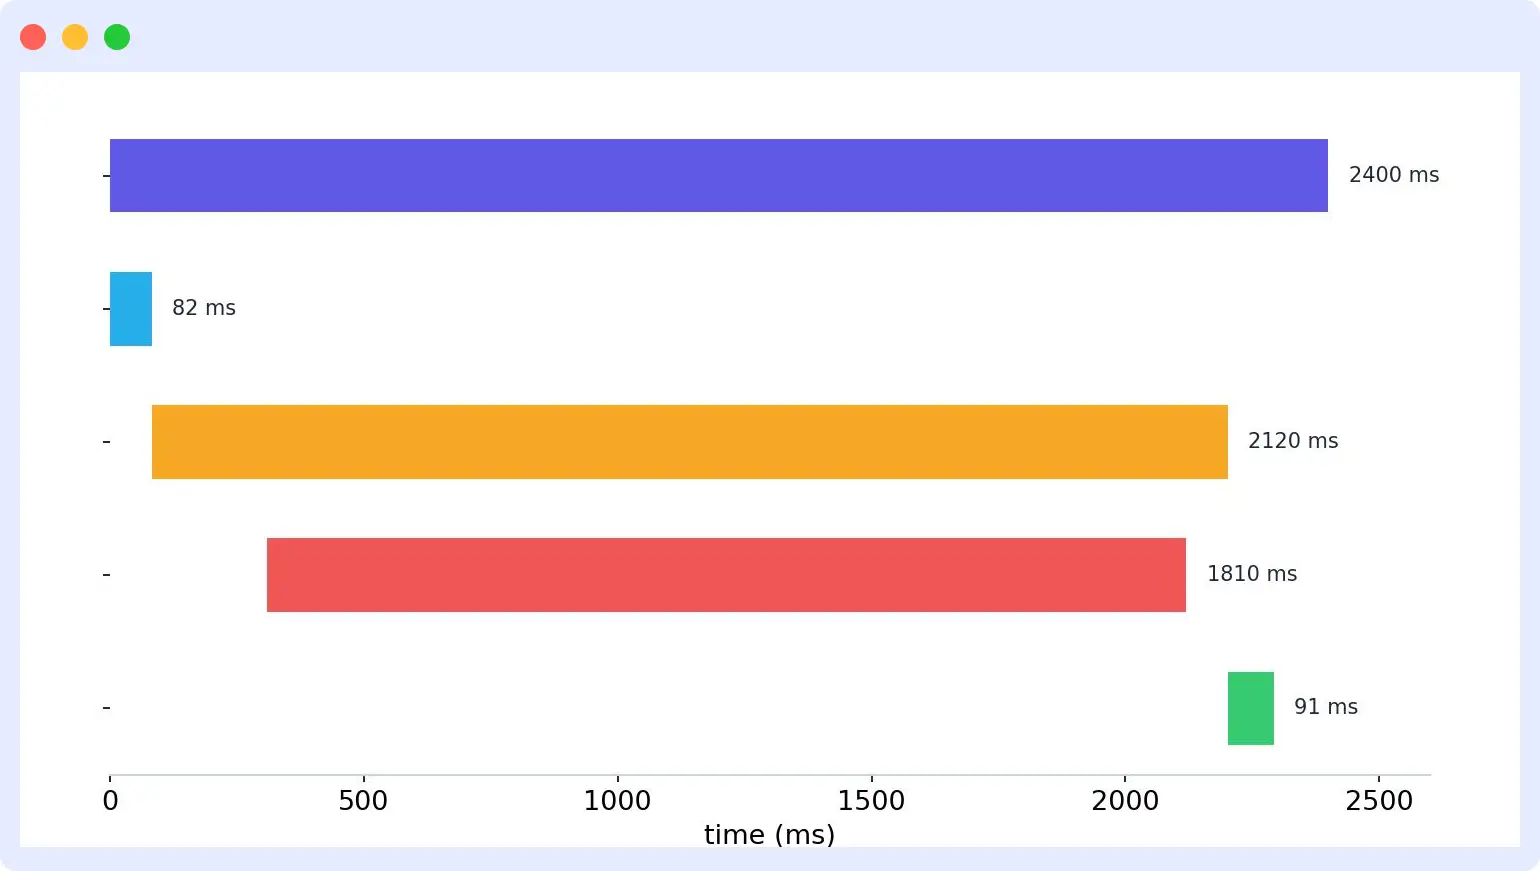
POST /checkout: 2.40s total
- inventory.reserve: 82ms
- payment. authorize: 2.12s
- PostgreSQL: 1.81s
- order.create: 91ms
Checkout looks slow from the outside. The trace shows it’s actually the payment database step, a completely different fix than what “checkout is slow” would suggest on its own.
Keep instrumentation consistent
Nobody enjoys the version of this lesson where two services log the same field under two different names, and a query that should take five minutes takes an hour because of it. OpenTelemetry’s semantic conventions exist specifically to prevent that: a shared naming standard so every service labels the same kind of data the same way.
| Domain | Attribute | Example |
|---|---|---|
| HTTP | http.request.method | POST |
| HTTP | http.route | /checkout |
| Database | db.system.name | postgresql |
| Service | service.name | payment |
Use automatic instrumentation for common frameworks, and add manual spans wherever business context is missing:
with tracer.start_as_current_span("payment.authorize") as span:
   span.set_attribute("payment.provider", "provider_a")
   result = authorize(order)
Check which version of the semantic conventions your SDK supports before standardizing attribute names, so you’re not renaming everything six months later.
Lesson 4: a successful API call means nothing once a queue is involved
This is the one that gets almost everyone at least once: the API returns 201, the dashboard shows a clean success, and the order still never ships. Context propagation, passing a request’s trace ID forward as it crosses services, is what keeps a transaction traceable once it leaves synchronous request/response and enters a queue.
When that link breaks, one transaction quietly splits into several unrelated traces, and nobody notices until a customer asks where their order went.
Standard HTTP instrumentation handles most of this automatically. Background jobs, internal wrappers, and messaging systems don’t, and they need to be tested explicitly, not assumed.
POST /orders: 201 Created
- order.created event published
- Inventory Consumer picks it up
- Fulfillment step runs
- Result: FAILED
The API call succeeded. The transaction didn’t. Watch producer errors, consumer lag, processing time, retries, and dead-letter messages, because this is where a “successful” request goes to quietly die.
Consumer lag depends on processing speed, not just backlog size: a backlog of 20,000 messages means something completely different at 500 messages per second than it does at 10.
Lesson 5: the answer is never in just one tool
Every seasoned engineer has a version of this story: p99 spikes, the trace shows exactly which span is slow, and the trace alone still doesn’t say why. Say checkout’s p99 rises from 400ms to 2.4 seconds, and a trace shows payment.authorize eating 2.1 seconds of it. The trace stops there. The log doesn’t.
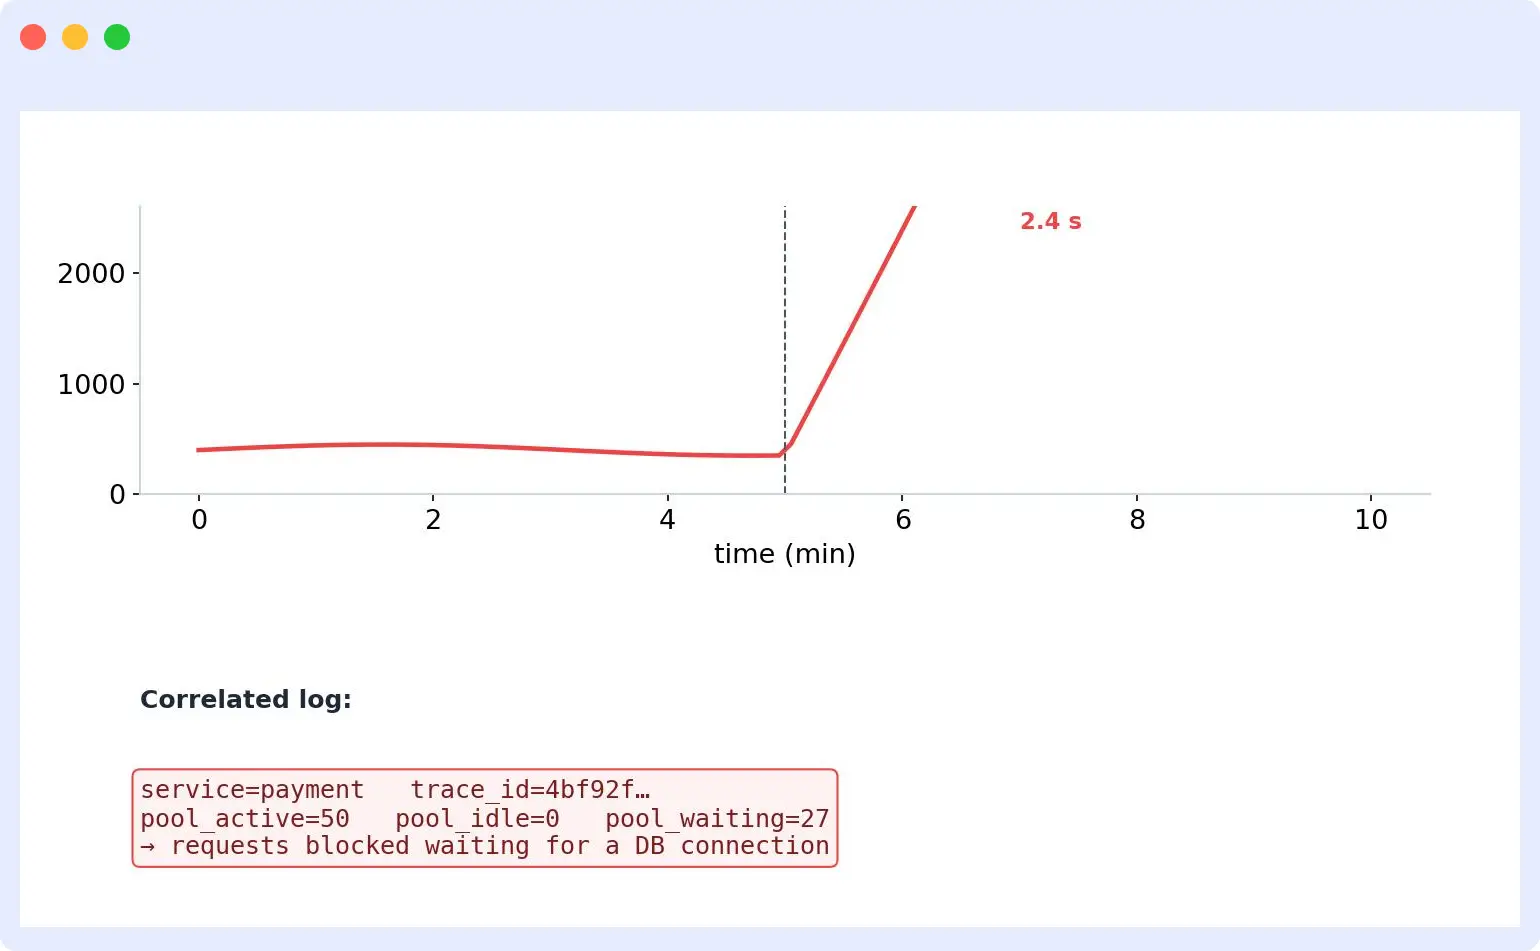
service=payment
trace_id=4bf92f...
pool_active=50
pool_idle=0
pool_waiting=27
Now the picture is complete: payment requests are waiting for a free database connection, not failing at the database itself. This only works if trace_id, span_id, service.name, and service.version are consistent everywhere, so you can move between logs and traces without losing your place. A profile, a detailed record of what code ran and for how long, is the next layer down when the bottleneck turns out to be application code itself.
An exemplar takes this one step further: it links one specific metric data point to the exact trace behind it, which is especially useful on latency charts. The lesson underneath all of this is the same one: don’t stop investigating at the first tool that has an opinion. If you’re evaluating APM tools, this correlation gap is exactly what to test for before you commit to one.
Lesson 6: a fast query can still be why everything is slow
This one trips up even good engineers, because it’s counterintuitive: the query is fast, and the database step is still slow.
| Database stage | Duration |
|---|---|
| Acquire connection | 790 ms |
| Execute query | 45 ms |
| Read result | 15 ms |
| Total | 850 ms |
Optimizing that 45ms query changes nothing here. Almost the entire 850ms is spent waiting for a connection, not running anything. Track connection wait time, pool usage, pending requests, query duration, errors, and timeouts as separate signals, not one blended “database is slow” number. For PostgreSQL, pg_stat_statements adds call counts and run-time stats per query.
Traces also expose N+1 queries, a pattern where one action quietly triggers dozens of small repeated queries instead of one combined one. Each query alone looks fine. The pattern is what’s slow. This is worth a closer look if it shows up often: common database optimization mistakes.
One more number worth watching: the cache-hit ratio, how often PostgreSQL finds data in memory instead of reading from disk. A drop can mean more disk reads, or it can just mean your data mix changed, so compare it against past behavior and query patterns instead of judging one number in isolation.
Lesson 7: retries turn a bad day into an outage
Nobody plans for this one; it just happens: a payment provider gets slow, retries kick in to compensate, and the retries themselves become the outage.
POST /payment: 2.20s total
- Internal processing: 120ms
- Payment provider: 2.03s
Without that breakdown, the full 2.2 seconds looks like your own application’s fault. Track latency, errors, timeouts, and rate-limit responses separately for every important outside dependency, because the difference between “our bug” and “their outage” changes everything about how you respond.
Watch retries as their own signal, not a footnote. When a dependency slows down, retries can flood it with even more traffic, and a partial degradation can become a full outage far more often than people expect. Use bounded retries with backoff and jitter, and make sure your monitoring can tell you whether retries help recovery or actively make things worse.
Retries and dependency failures explain a lot of backend slowness. They don’t explain all of it. Some of the worst experiences never touch the backend at all.
Lesson 8: a fast API doesn’t mean a fast app
This is the lesson backend engineers learn from frontend complaints they initially don’t believe: the API answers in 180ms, and the page still takes four seconds to feel usable. That gap lives somewhere backend monitoring can’t see: JavaScript execution, image loading, third-party scripts, rendering.
Real User Monitoring (RUM) measures performance from real visitors’ sessions, on their actual devices and networks. A page might load in 1.2 seconds on a fast laptop with fiber and take five seconds on a mid-range phone on 3G; a gap that averages hide completely. Synthetic monitoring complements this by running the same test repeatedly for key journeys like login and checkout, catching regressions before real users do.
Core Web Vitals, LCP (load speed), INP (responsiveness), and CLS (visual stability), separate rendering and interaction problems from backend latency. The step most teams skip is linking frontend requests to backend traces, and it’s the one that actually resolves this lesson: without it, a slow page load and a slow API call look like two separate incidents even when they’re the same one. This is where RUM and synthetic monitoring work together.
“Dynamo LED Displays ran into exactly this pattern: “We saw LCP spikes only on specific Android players during hot afternoons and FID issues when venues switched to a 4G backup link. RUM helped us pinpoint these conditions instantly, insights traditional monitoring missed,”
Daniel Reynolds, Marketing Director at Dynamo LED Displays.
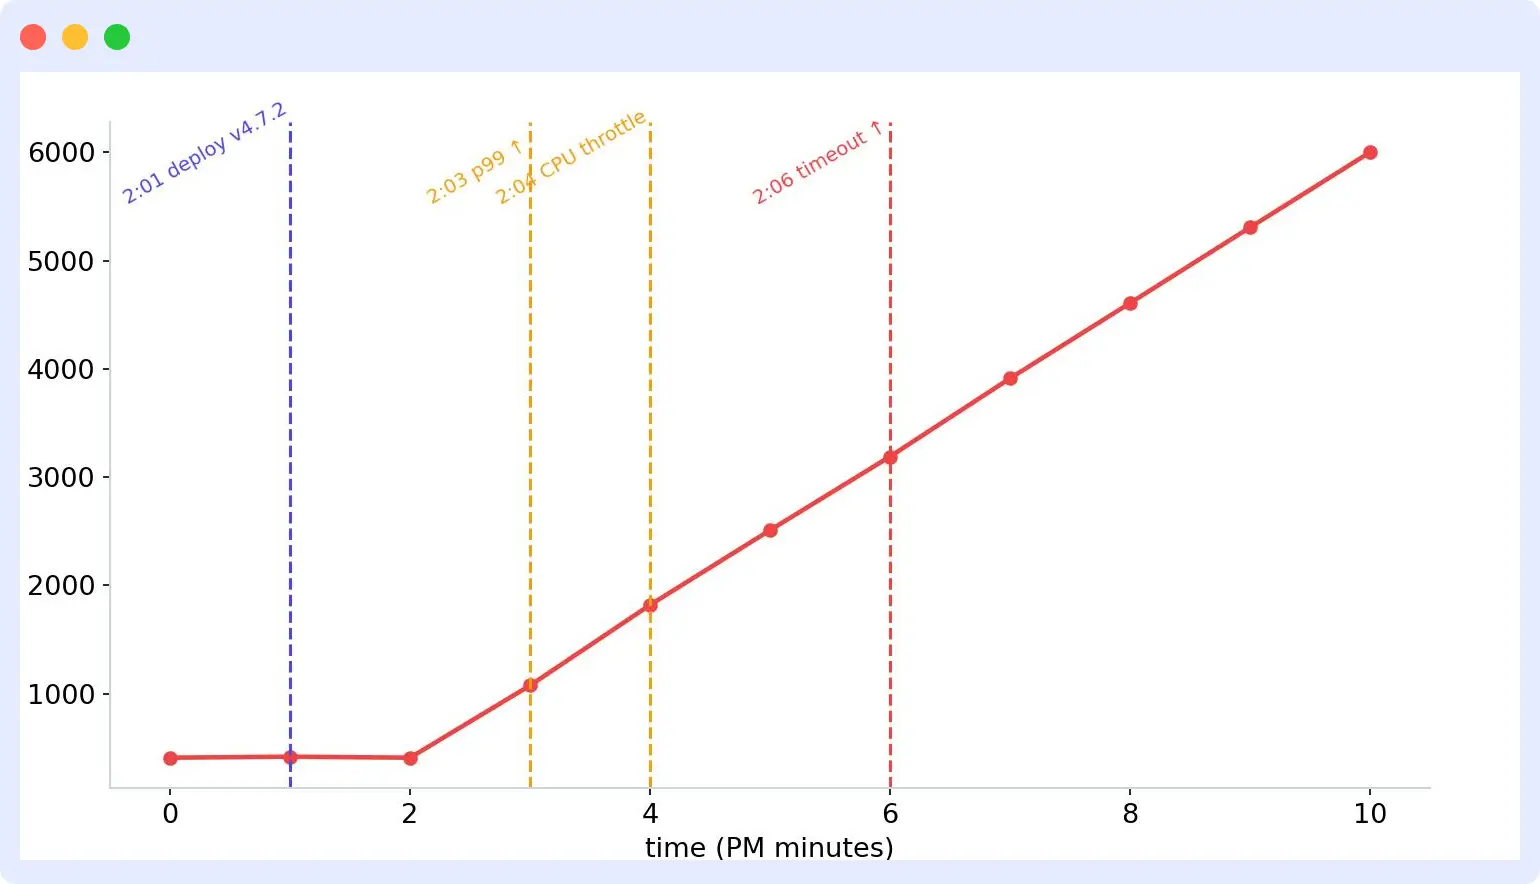
Lesson 9: check what shipped before you check anything else
Ask any engineer with enough incidents behind them what the first question is, and it’s rarely a metric. It’s “what deployed recently.”
| Time | Observation |
|---|---|
| 2:01 PM | checkout:v4.7.2 deployed |
| 2:03 PM | p99 increases |
| 2:04 PM | CPU throttling increases |
| 2:06 PM | Timeout rate increases |
This timeline doesn’t prove the deploy caused the regression. It gives you a strong first hypothesis to test, which during an incident is worth more than a dozen unconfirmed theories.
Watch CPU throttling in Kubernetes
Here’s a specific version of this lesson that catches people running on Kubernetes: CPU requests affect scheduling, CPU limits can cause throttling, and a quick kubectl top check can miss short throttling spikes entirely. Kubernetes-specific metrics matter here precisely because the quick check doesn’t tell the whole story.
Compare app latency against throttling and CPU limits, and check replica count and pod age when latency shows up during a scale-out. New pods need time to warm up, connect, or fill their cache, and separating that normal startup delay from real steady-state latency stops a routine scale-out from looking like an outage.
If you’re setting this up on Middleware, here’s a walkthrough of monitoring a Kubernetes application with Middleware.
Lesson 10: page on what users feel, not what your servers are doing
Every team with a noisy on-call rotation has learned this the same way: high CPU doesn’t mean anything is actually wrong.
| Alerting approach | What it catches | What it misses |
|---|---|---|
| Infrastructure-first (CPU, memory thresholds) | Resource limits before they show up elsewhere | Failures at normal resource use, like pool exhaustion |
| User-impact-first (error rate, latency, SLO burn) | What users actually experience | Nothing on its own, but still needs infra data for context |
One service runs fine at 85% CPU. Another fails requests at 40% CPU because its database pool ran out. The lesson is to alert on app outcomes first: error rate, tail latency, failed transactions, SLO burn, and treat infrastructure signals as context you pull in after the alert fires, not the trigger itself.
Use burn-rate alerts for SLOs
A burn-rate alert shows how fast a service is spending its error budget. Google’s own guidance for a 99.9% SLO uses a 14.4x burn rate across a one-hour and five-minute window, which pairs well with a broader effort at reducing alert fatigue across a team that’s tired of being paged for nothing.
Lesson 11: you can’t keep everything, so keep the right things
Every team that’s ever gotten a telemetry bill they didn’t expect has learned this lesson at the worst possible time. Sampling means recording only some requests instead of all of them, and a service handling 10,000 requests per second generates an enormous volume of trace data if every request is captured in full.
Head sampling decides at the start of a trace, cheap but blind to which requests will matter. Tail sampling waits until the trace completes, then keeps the ones that actually matter:
- Errors: retain
- Latency over 2 seconds: retain
- Critical transactions: retain more
- Healthy traffic: sample
There’s no universal rate. Base it on traffic volume, telemetry budget, and how much detail you actually need mid-incident.
Cardinality is the sibling lesson here: a label like http.route has a handful of values, fine. A label like user_id can have millions, and each unique combination quietly becomes its own stored time series. Route, region, method, and status code are safe as metric labels. User IDs, session IDs, and raw URLs are not; keep those in traces or logs, and use normalized routes like /users/{id} for metrics.
Lesson 12: your logs are a liability, not just a tool
This lesson usually gets learned during a security review, not an incident, which is worse timing. Logs and traces can carry headers, query text, error messages, and request details, some of it sensitive, and it’s easy not to notice until someone else does.
Collect only what actually helps you debug. Strip credentials and sensitive values before export, and avoid capturing full request or response bodies by default. Check what your auto-instrumentation captures before it goes live, especially database statements and custom fields, because “we didn’t mean to log that” is a sentence nobody wants to say twice.
Good log management and clean application logs start with deciding what you actually need, not with capturing everything and sorting it out later. Redaction at the collector level adds a layer of protection, but the safest data is the data that never entered the pipeline in the first place. LLM-backed features add one more version of this lesson on top.
Lesson 13: a model that answers fast can still be wrong
This is the newest lesson on this list, and the one fewest teams have internalized yet. Applications built on large language models add signals that behave nothing like a normal function call: latency varies, cost varies per request, and quality can degrade without ever tripping an error or a timeout.
Track model latency, time to first token, input and output token counts, errors, timeouts, and fallback behavior, and keep model calls inside the same distributed trace as everything else.
POST /support-answer: 3.4s total
- retrieve_context: 210ms
- vector_search: 140ms
- model.generate: 2.9s
The trace makes it obvious: model generation is what’s slow here, not retrieval.
Here’s the version of this lesson that catches people off guard: the primary model times out, the app falls back to a smaller model, and the fallback succeeds, just with worse answers, while latency looks completely normal. Nothing pages anyone. Trace the fallback path as its own event and monitor fallback rate separately, because it’s the only signal that catches this.
GenAI semantic conventions for OpenTelemetry are still being defined, so check the spec and your SDK’s support before you standardize on attribute names. Don’t log raw prompts and responses by default; they carry sensitive data and generate telemetry volume fast.
Lesson 14: missing data looks exactly like good news
This is the hardest lesson to learn because it looks like nothing happened.
Application → OTel SDK → Collector → Exporter → Observability backend
Every trace, metric, and log has to survive this pipeline before it’s useful, and it’s tempting to treat it as plumbing that just works. It’s real infrastructure with real failure modes, and those failures are dangerous precisely because they’re silent.
A collector that gets overloaded during an incident, exactly when traffic and telemetry both spike, can start quietly dropping spans and log lines. Dashboards keep showing data. Everything looks fine. The specific evidence you need is just gone.
Watch export failures, collector queue size, dropped data, and ingestion delay as their own monitored signals, not an afterthought. A pipeline quietly dropping data and a system with no gaps at all look identical from a dashboard, until something breaks and you go looking for evidence that isn’t there.
Lesson 15: Every incident is a monitoring audit, whether you plan for it or not
The best engineers don’t just close incidents; they interrogate what the incident revealed about their own blind spots. Could you follow the request start to end? Was the deployment visible? Did trace context survive the async steps? Did sampling remove the one trace you actually needed?
| Coverage area | Example check |
|---|---|
| Services | Are all production services sending telemetry? |
| Critical transactions | Are important flows traced start to end? |
| Queues | Are producers and consumers connected? |
| Dependencies | Are key databases and APIs visible? |
| Deployments | Can telemetry be split by version? |
Check coverage whenever the architecture changes too. New services and dependencies routinely ship with weaker monitoring than everything already in production, and missing telemetry never means everything’s fine; it usually means nobody’s checked yet.
What to avoid in application monitoring
Every lesson above has a mirror-image mistake, and these are the ones that show up again and again (for a deeper breakdown of fixes for each, see 14 common application performance issues and how to fix them):
- Trusting average latency: it can look fine while a small group of requests takes seconds. Track p95 and p99 instead.
- Treating HTTP success as real success: a 200 response only means the request finished. Payments and orders can still fail later, so track outcomes separately.
- Alerting on every resource spike: high CPU or memory doesn’t always mean users are affected. Focus on latency, error rate, and failed transactions instead.
- Tracing everything: instrumenting every function adds noise without helping you debug faster. Focus on service boundaries, databases, queues, and outside APIs.
- Ignoring database wait time: a database step can look slow even when the query is fast. Split connection wait, pool wait, and query time before you optimize anything.
- Using high-cardinality metric labels: request IDs, user IDs, and raw URLs create too many time series. Keep those in logs or traces, not metrics.
- Ignoring retries: retries can turn a small slowdown into a major outage. Track retry rate next to timeouts and latency.
- Watching services in isolation: a healthy dashboard for one service doesn’t mean the whole transaction is healthy. Keep trace context across every step.
- Assuming missing data means everything’s fine: it might mean broken instrumentation or an overloaded collector instead. Monitor your pipeline too.
- Setting up monitoring once and forgetting it: your app keeps changing. Review your monitoring after every architecture change and every incident.
Application monitoring checklist for best practices
- Critical transactions: identify key flows like checkout, payment, and login, and connect them to SLOs and business outcomes.
- Latency: track p50, p95, and p99. Tail numbers show slow requests that averages hide.
- Errors: capture app errors and failed business transactions. A successful HTTP response doesn’t always mean the transaction itself worked.
- Tracing: trace requests across key service and dependency steps, including databases, queues, caches, and outside APIs.
- Context propagation: check that trace context survives across services, background jobs, and messaging. A broken link creates incomplete traces.
- Databases: split connection wait time from query time, and track pool use, pending requests, and query latency.
- External APIs: track latency, errors, timeouts, rate limits, and retries for each dependency, so you can tell outside failures from your own bugs.
- Frontend: connect browser performance to backend telemetry with RUM, so you know if a delay starts in the frontend or the backend.
- Deployments: add service versions and deploy events to your telemetry, so regressions are easy to trace back to a release.
- Scaling: compare latency to replica changes, pod age, and startup behavior. Cold starts and cache warming can look like slowdowns.
- Alerts: alert on user impact, not just resource spikes. Prioritize SLO burn, latency, errors, and failed transactions.
- Sampling: keep more data for failed, slow, and critical traces. Sample routine healthy traffic to control cost.
- Cardinality: keep unbounded values like user IDs and raw URLs out of metric labels. Put that data in logs or traces instead.
- Telemetry security: strip sensitive data like credentials from logs and traces before you export them.
- Telemetry pipeline: watch collector queues, export failures, and ingestion delay, since missing data can make a broken app look healthy.
- Monitoring coverage: review instrumentation every time services or dependencies change, so new parts don’t ship with weak monitoring.
How Middleware helps with application monitoring
OpsAI is Middleware’s AI SRE agent, built on top of Middleware’s APM, and it exists because every lesson above is really the same lesson: the answer is never in one tool, and finding it manually costs time nobody has during an incident. OpsAI is built to run that same connected investigation automatically.
Middleware keeps the whole thing connected end to end, so engineers can start with one slow transaction and follow it into the exact service, dependency, log line, or piece of infrastructure behind it, without manually pivoting between separate tools for traces, logs, and metrics. Generation Esports used Middleware to cut mean time to resolution by 75%, this kind of correlated investigation is exactly why.
A checkout problem, for example, might trace back like this:
Checkout p99 spike → slow payment traces → database connection waits → pool exhaustion in logs → deployment confirms the cause
That’s lessons 5, 6, and 9 above, just automated. Middleware is built on OpenTelemetry, so instrumentation done using the practices in this guide keeps working with the same SDKs and collectors, nothing to rip out or redo.
The same pattern extends to infrastructure, not just application code. Kubernetes pod crashes are one example OpsAI can catch and remediate automatically, using the same correlated metrics, logs, and deployment history from lesson 9. OpsAI surfaces the likely root cause with the evidence behind it, so the investigation this guide describes doesn’t start from zero every time.
FAQs
What are application monitoring best practices for microservices?
Track critical transactions with tail latency, errors, saturation, and distributed traces. Keep context linked across HTTP, RPC, databases, queues, and outside APIs.
Which application performance metrics should developers monitor?
Start with p95 and p99 latency, throughput, error rate, and saturation. Add database waits, queue lag, retry rate, dependency latency, and transaction success where they matter.
How do you find the root cause of application latency?
Check the affected route’s tail latency, then use slow traces to find the longest steps. Matching logs and infrastructure metrics explain why those steps slowed down.
How do you detect slow API requests in production?
Track p95 and p99 latency by route, then look at traces from slow requests. Compare them to normal traces to find the service or dependency adding the delay.
How do you monitor applications running on Kubernetes?
Compare app latency to CPU throttling, memory pressure, pod restarts, replica changes, pod age, and deploys. This separates app problems from scaling and infrastructure issues.
How do you reduce alert fatigue in application monitoring?
Alert on things users actually feel, like SLO burn, tail latency, and failed transactions. Use infrastructure data as context, not as the main trigger.
How do you monitor database performance from an application?
Track connection wait time, pool use, query duration, errors, and timeouts. This separates a slow query from a delay caused by waiting for a connection.
How do you reduce APM telemetry costs?
Sample routine successful traffic, but keep more data from failed, slow, and critical traces. Keep high-cardinality values like user IDs out of your metrics.
What’s the difference between application monitoring and observability?
Monitoring watches predefined metrics, logs, and thresholds for problems you already know to look for. Observability is the ability to ask new questions about your system’s internal state after something breaks, using the same telemetry, without adding new instrumentation first.
What are the different types of application monitoring?
The main types are APM (code-level performance), infrastructure monitoring (servers and containers), real user monitoring and synthetic monitoring (actual and simulated user experience), and log monitoring (system-generated records). Most real investigations combine several of these at once.
