Author: Keval Bhogayata
-
How to Manage Docker Container Logs for Monitoring & Troubleshooting
Learn how to manage Docker container logs effectively to streamline monitoring, troubleshoot issues faster, and optimize application performance.
-
How to Use Prometheus Pod Monitor for Pod-Level Metrics Collection
In Kubernetes, everything runs inside pods. Instead of dealing with containers one by one, Kubernetes uses pods to group them together and manage them more easily. That’s why monitoring pods is so important. You need to know if your apps are running smoothly and how much CPU or memory they’re using. That’s where Prometheus comes…
-
Prometheus Labels: Understanding and Best Practices
In observability, Prometheus is a well-known tool amongst SREs and engineers alike. What makes Prometheus so effective is the labels Prometheus implements, which provide context to its metrics and facilitate operations such as filtering and aggregations. New to Prometheus? Learn how it works and why it’s critical for observability in our beginner-friendly guide. By the…
-
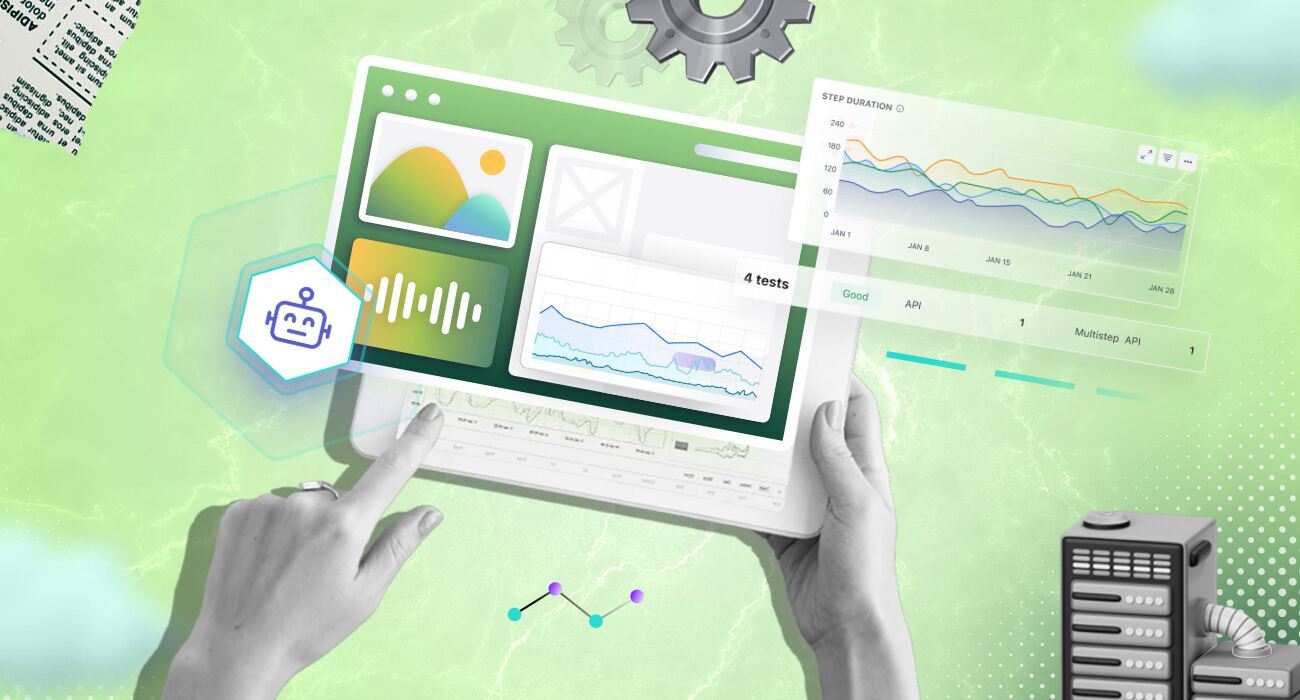
Understanding API Metrics: What to Monitor in Your API
APIs have significantly changed the way modern software applications are developed. They allow communication and transfer of information between different systems. As many organizations now adopt the API-first design, developers, DevOps, and Product teams need to understand how APIs work. Measuring these APIs’ performance is an important thing to consider because it helps assess their…
-
Kubernetes vs Docker: Understanding Their Roles and Differences
Kubernetes vs Docker – discover the key differences, use cases, and how they power modern DevOps and container orchestration.
-
Detailed Guide to Prometheus Metrics
Learn how to collect, analyze, and visualize Prometheus metrics effectively. This step-by-step guide covers counters, gauges, histograms, and summaries to help you monitor system performance with ease.
-
Prometheus vs Grafana: Which Tool Suits Your Monitoring Needs?
We tested them in a real-world cloud stack to uncover which tool deserves a place in your monitoring arsenal (and why most teams need both).
-
Understanding OpenTelementry Metrics: Type, Models and Best Practices
Learn how OpenTelemetry metrics can help you track performance, optimize resources, and integrate with existing tools to improve overall observability and tackle issues before they start affecting end users.
-
How Does Prometheus Work?
Prometheus is a powerful open-source tool widely used for collecting, storing, and analyzing metrics as part of the Prometheus architecture in modern cloud-native environments. It is an important aspect of modern observability technologies since it offers a scalable, pull-based data collection technique as part of the Prometheus architecture. It easily interfaces with cloud services like…
-
How can synthetic monitoring enhance website reliability?
Understand how you can proactively enhance your website’s performance and reliability with Middleware’s synthetic monitoring.
-
Best Monitoring Practices for AWS CloudTrail Logs
Learn how to set up, monitor, and analyze AWS CloudTrail logs for enhanced security, compliance, and operational troubleshooting.
-
Java Garbage Collection: What is it, and How does it Work?
Imagine your Java application is a thriving online store, buzzing with activity. On a big sale day, the excitement peaks—but suddenly, your application starts slowing down, orders get delayed, and then it crashes. While there are many reasons an application might slow down or crash, such as high CPU usage, slow database queries, or inefficient…