Category: Knowledge
-
How We Built an AI SRE Agent That Troubleshoots Production Issues Like a Team of Engineers
We built OpsAI because investigating a production incident has become one of the hardest cognitive tasks in software engineering, and the industry’s answer has been to add more dashboards. That’s the wrong answer. As distributed environments grow, the signals get noisier, failures span more systems, and Kubernetes adds layers that nobody fully understands at 3…
-
Logging vs Monitoring: What’s the Difference?
TL;DR: Logging records what happened inside your system. Monitoring watches whether your system is healthy right now. They answer different questions, and neither replaces the other. Logging and monitoring are two of the most commonly used terms in DevOps and engineering, often mentioned together, but they are not the same thing and do not do…
-
Kubernetes & Docker Exit Code 143: Meaning, Causes, and Debugging Guide
When you see exit code 143 and your container stops, the instinct is to assume something broke. In most cases, the container received a shutdown signal and exited on its own. What matters is whether your application handled that signal correctly. In production, how your application handles that shutdown determines whether users see dropped requests,…
-
Complete Guide to Windows Performance Monitoring with Middleware
Windows performance monitoring is critical because Windows servers fail quietly. Memory leaks grow for days before performance tanks. Disk space runs out slowly until SQL Server crashes. These Windows server performance issues often go unnoticed until users report them. CPU spikes at 3 AM, and nobody notices until users call in the morning. You find…
-
The Complete Guide to Observability Pipelines
You know that moment when something breaks in production? Alerts go off, you open logs, and it’s just… noise. Different formats, useless messages, missing context, and the one thing you need isn’t there. That’s the current state of telemetry for most teams. An observability pipeline sits between your data sources and your monitoring tools. It…
-
A New Chapter for Middleware: Joining the Microsoft Pegasus Program 2026
Today marks a defining moment in Middleware’s journey. We’ve been selected for the invite-only Microsoft for Startups Pegasus Program 2026 and are now live on the Microsoft Azure Marketplace. This is more than an accelerator entry; it signals enterprise alignment, technical maturity, and the start of a deep collaboration with Microsoft’s global ecosystem. Table of…
-
How to Do Effective Infrastructure Monitoring for Windows with Middleware
Learn how to set up Windows infrastructure monitoring with Middleware. Track CPU, memory, disk, and network metrics and detect issues before they impact users.
-
What is Endpoint Monitoring? A Guide to Performance & Security
Learn what endpoint monitoring is, how it works, and how to build a strategy that improves performance, security, and incident response.
-
Go Error Handling: Complete Guide with Examples
Master Go error handling: wrap errors with %w, build custom types, use errors.Is/As, and debug production failures with full context and stack traces.
-
Diagnosing Abnormal Kubernetes Workload Behavior with Observability
Troubleshoot Kubernetes workload issues faster with unified metrics, events, and logs. See how full-stack observability helps identify root causes in minutes.
-
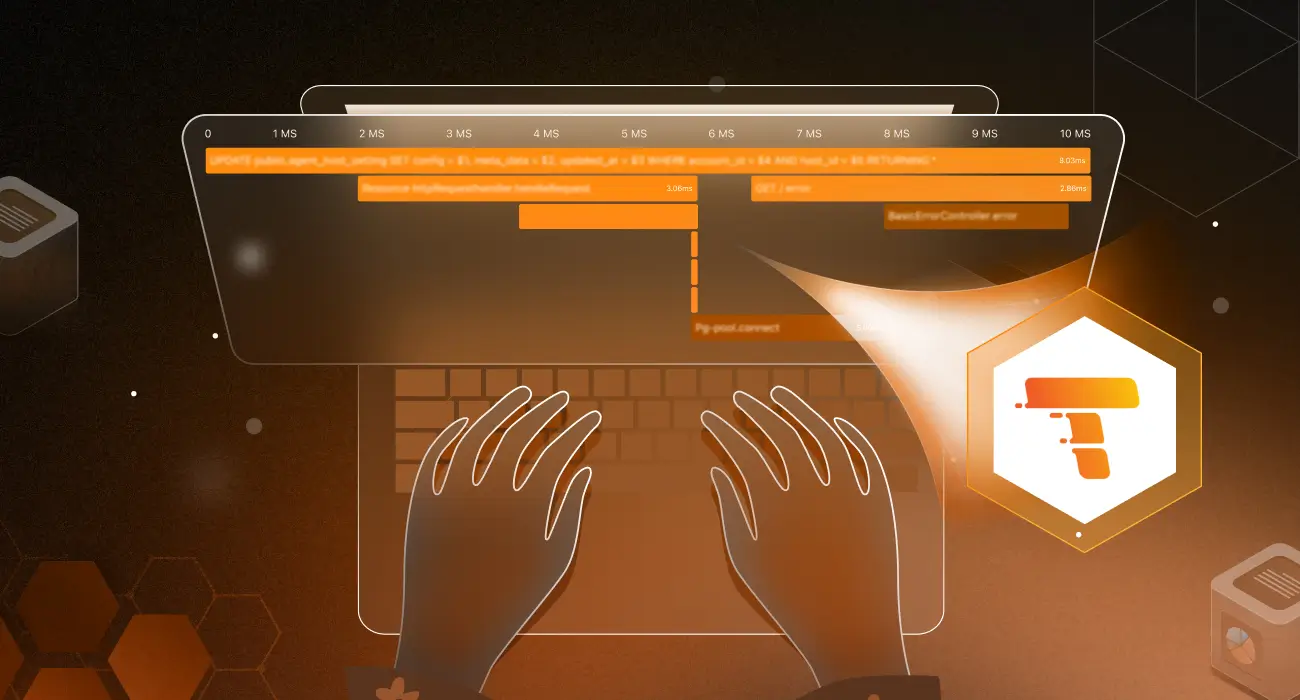
Grafana Tempo: Simplifying Distributed Tracing at Scale
Learn how Grafana Tempo simplifies distributed tracing at scale using object storage and how to get started with TraceQL, Helm, and Grafana
-
How to Monitor Linux Infrastructure with Middleware
Monitor your Linux servers with Middleware. This guide covers installation, key metrics, alert setup, and best practices to prevent downtime and catch issues early.
