Tag: Performance
-
How AI-driven alerts caught a memory leak before it became an outage
A memory leak was growing quietly in production, invisible to threshold-based monitoring. Within hours of deploying the middleware, the team behind it received an AI-driven alert that flagged the anomaly before it could cascade into a full outage. TL;DR A memory leak grew silently in production until an AI-driven alert flagged the anomaly hours before pods would…
-
Docker Health Checks: How to Monitor, Configure, and Troubleshoot Container Health
Docker health checks are used to determine if an application running inside a container is actually functioning correctly and not just if the container process is running. A container can appear “up” while its application is unresponsive, misconfigured, or unable to reach required dependencies. Health checks solve this gap by actively validating real application behavior.…
-

Database Optimization: A Complete Guide to Faster Queries and Better Performance
Summary: Database optimization is the practice of tuning queries, indexes, and infrastructure so your database returns results faster while using fewer resources. Most performance problems come from missing indexes, inefficient queries, or undersized resources, and most can be fixed without rebuilding your system. The biggest mistake teams make is optimizing before measuring, which wastes time…
-
OOMKilled Kubernetes Error: How to Detect, Fix, and Prevent It
OOMKilled Kubernetes error is one of the most disruptive errors in containerized production environments. The Linux kernel kills your container mid-flight with no warning, drops all in-flight requests, and forces Kubernetes to restart the workload from scratch. If the root cause is not addressed, the cycle repeats until the pod enters CrashLoopBackOff and your service…
-
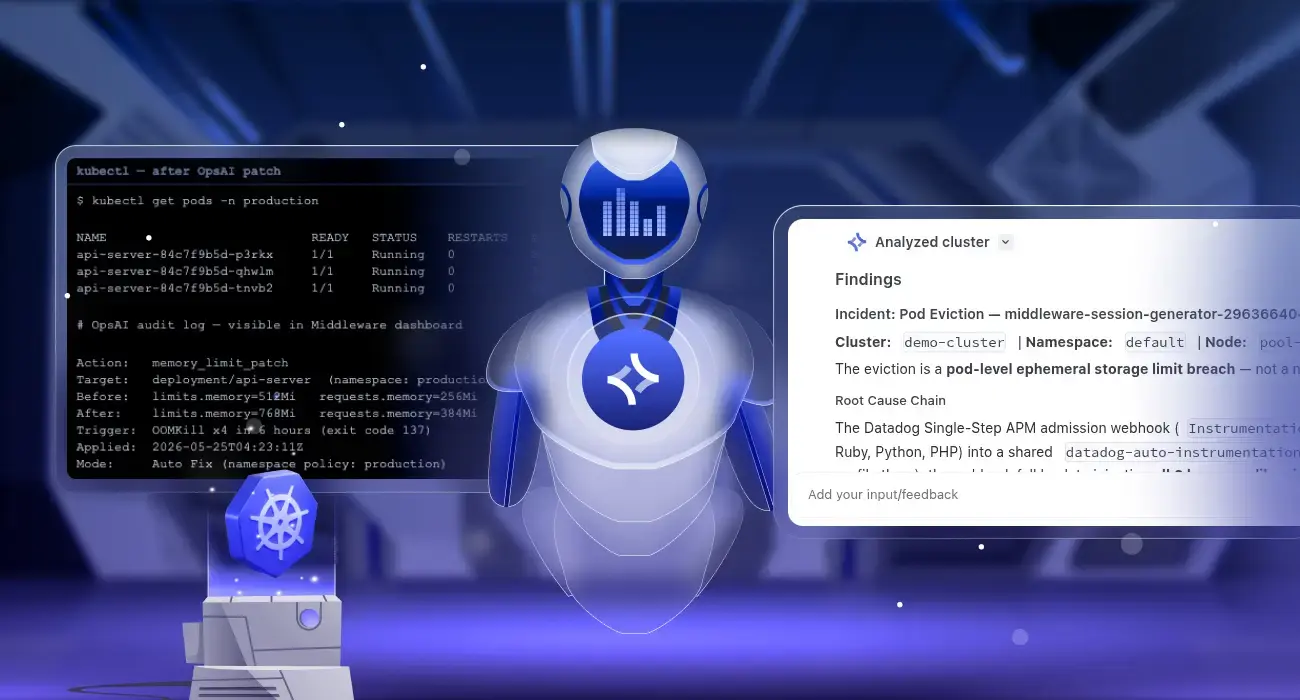
Kubernetes Self-Healing: Automatic Pod Crash Remediation with OpsAI
Kubernetes pod crash auto-remediation is the ability to automatically detect why a pod crashed and apply a permanent fix without human intervention. Middleware OpsAI does this by monitoring Kubernetes events, pod metrics, and container logs in real time, diagnosing the root cause of each failure, and patching the cluster directly, for example, raising a memory…
-
How AI Is Changing the Way DevOps Teams Debug Production Issues
TL;DR AI compresses the gap between “something’s wrong” and “here’s why” — without replacing engineers Middleware OpsAI is an AI agent that detects, investigates, explains and fixes production incidents automatically Anomaly detection catches issues before they cross alert thresholds Log clustering + natural language queries replace manual log searching Automated root cause analysis cuts 30-minute…
-

How We Built an AI SRE Agent That Troubleshoots Production Issues Like a Team of Engineers
We built OpsAI because investigating a production incident has become one of the hardest cognitive tasks in software engineering, and the industry’s answer has been to add more dashboards. That’s the wrong answer. As distributed environments grow, the signals get noisier, failures span more systems, and Kubernetes adds layers that nobody fully understands at 3…
-
Kubernetes & Docker Exit Code 143: Meaning, Causes, and Debugging Guide
When you see exit code 143 and your container stops, the instinct is to assume something broke. In most cases, the container received a shutdown signal and exited on its own. What matters is whether your application handled that signal correctly. In production, how your application handles that shutdown determines whether users see dropped requests,…
-
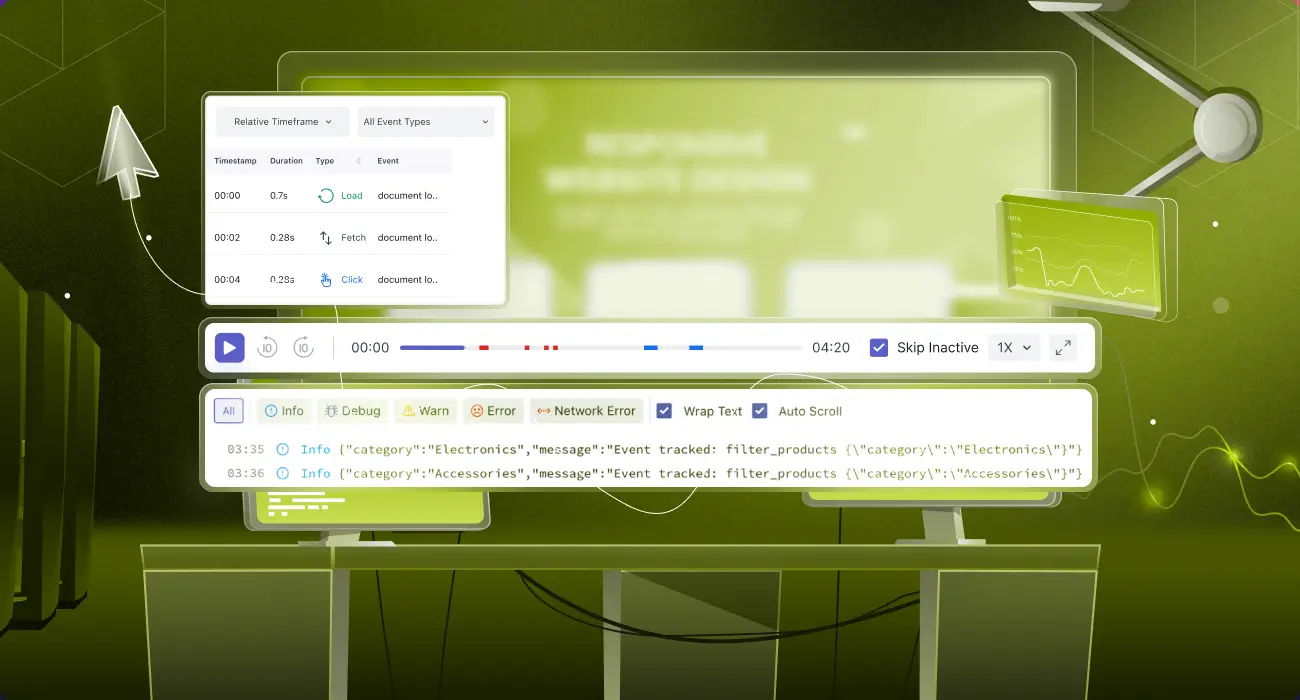
Frontend Performance Metrics: Bridging the Gap from Browser to Backend with RUM and Tracing
Frontend performance metrics measure how quickly and smoothly a web or mobile application behaves for users. This includes load time, interactivity, and visual stability across different devices, browsers, and app environments. Frontend performance metrics often show that something is wrong, but they fail to explain who is affected, how it impacts users, and where the…
-
What is a Flaky Test? Causes, Identification & Remediation
Flaky tests slow CI/CD pipelines and erode trust. Learn why they happen, how to detect them early, and how observability helps eliminate test instability.
-

How to Monitor Mobile App Performance with Synthetic Testing
Learn how to monitor mobile app performance with synthetic testing and RUM. Simulate user flows, track APIs, and ensure seamless app experiences.
-
Proactive Alerts for Slow APIs
Learn how proactive alerts for slow APIs prevent downtime, reduce latency issues, protect SLAs, and keep your user experience fast and reliable.