Tag: Observability
-
AWS Lambda Observability With Middleware: A Setup Guide
Lambda makes shipping serverless applications fast, but troubleshooting slow executions, cold starts, or failed invocations often means switching between CloudWatch, X-Ray, and multiple monitoring tools. This guide walks you through setting up end-to-end AWS Lambda observability with Middleware from connecting your AWS account and enabling OpenTelemetry-based remote instrumentation to collecting correlated logs, metrics, and traces.…
-

Podman vs Docker: Which Container Runtime Wins in 2026?
Summary: Podman and Docker both run OCI-compliant containers, but they solve the problem in fundamentally different ways: Docker centralizes everything through a root-privileged daemon, while Podman runs each container as a daemonless, rootless user process. That architectural split drives nearly every other difference in this comparison, from security posture to startup speed to Kubernetes alignment.…
-
Kubernetes CrashLoopBackOff: Causes, Diagnosis, and Fixes
Summary: CrashLoopBackOff is one of the most common and most frustrating Kubernetes errors engineers face in production. It means a container keeps crashing and restarting in a loop, but the error actually causing it is hidden inside logs and exit codes that most guides gloss over. This article covers every root cause in depth, gives…
-
AWS ECS vs EKS: What’s the Difference and Which Should You Choose?
Summary: Use AWS ECS if your team wants AWS-native simplicity, lower operational overhead, and no per-cluster fee. Use AWS EKS if you need Kubernetes portability, the CNCF tooling ecosystem (Helm, Argo CD, Istio), or fine-grained autoscaling like KEDA and Karpenter. Both run on EC2 or Fargate, both are production-proven at massive scale, and neither is objectively…
-
6 Practices High-Performing DevOps Teams Use to Cut MTTR in Half
The difference between a 10-minute incident and a 2-hour outage often comes down to six specific practices. Teams that master these consistently report 50% faster resolution times and significantly fewer escalations. This guide breaks down what those practices are, why they work, and how to start implementing them today. Tool sprawl is one of the…
-
What is Log Parsing? Techniques and Best Practices
Summary: Log parsing is the process of converting raw log entries into structured fields that can be searched, filtered, and analyzed. Teams use techniques such as regex, Grok patterns, and JSON parsing to extract data from different log formats. Parsing can happen at different stages of the pipeline, including the application, collector, ingest layer, or…
-
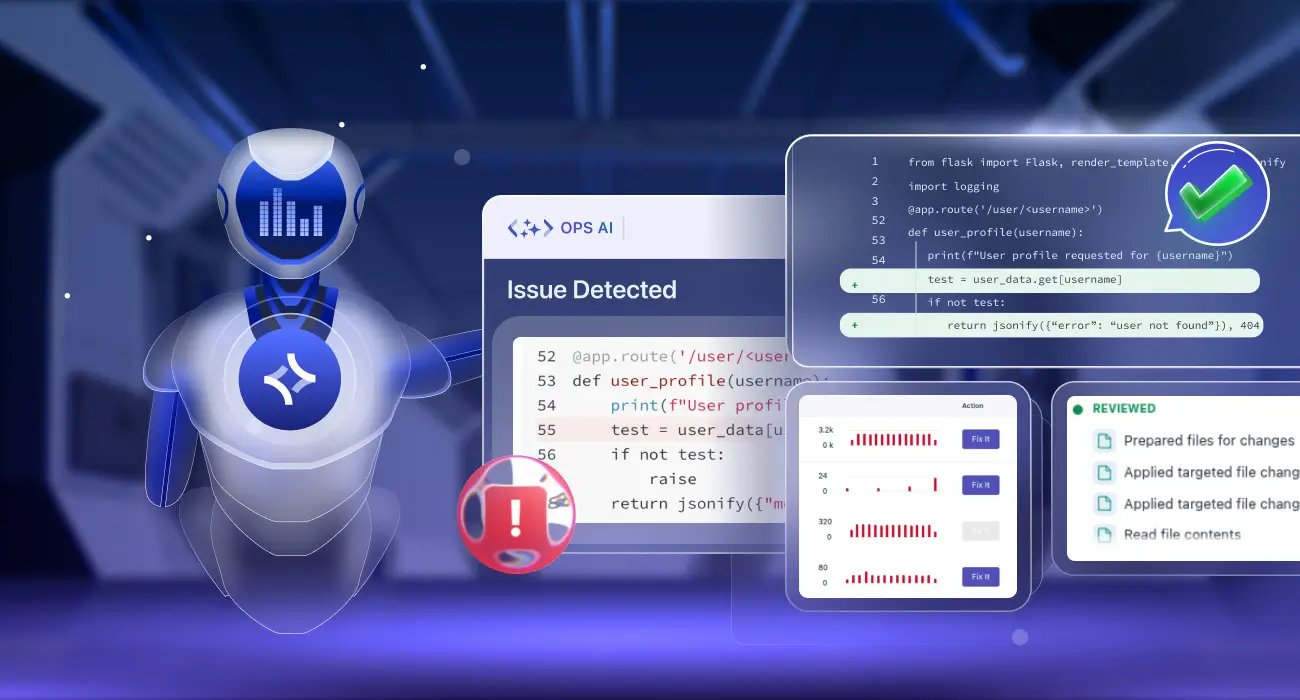
OpsAI for Repeat Incidents: How Automated Incident Response Prevents the Same Outage Twice
Summary: Repeat incidents are not bad luck they are a failure of incident memory. Most production systems alert on symptoms, restart pods, and close tickets, but never retain the pattern so they can recognize the same failure next week. This post explains exactly how Middleware OpsAI delivers automated incident response across your full stack: using…
-
Database Optimization: A Complete Guide to Faster Queries and Better Performance
Summary: Database optimization is the practice of tuning queries, indexes, and infrastructure so your database returns results faster while using fewer resources. Most performance problems come from missing indexes, inefficient queries, or undersized resources, and most can be fixed without rebuilding your system. The biggest mistake teams make is optimizing before measuring, which wastes time…
-
13 Best OpenTelemetry Tools in 2026: Ranked for DevOps and SRE Teams
Summary: OpenTelemetry tools are observability backends that ingest, store, and query telemetry data – metrics, logs, and traces – collected using the OpenTelemetry standard. OpenTelemetry (OTel) itself is a CNCF project that defines how applications emit telemetry: language SDKs for instrumentation, the OTel Collector for processing, and OTLP as the wire protocol for delivery. The…
-
How Middleware Turns OpenTelemetry Data Into Actionable Intelligence – Part 2
In part1, we covered how Middleware helps engineering teams new to OpenTelemetry achieve full infrastructure and application coverage in hours rather than weeks through auto-discovery, zero-code instrumentation, and UI-based collector configuration. In this blog post, I will be going to discuss about platform teams who are already using OpenTelemetry setup in their infrastructure and applications. What…
-

How Middleware Makes OpenTelemetry-Based Observability Setup Faster – Part 1
TL;DR OpenTelemetry is the default choice for observability, but getting it fully configured across a real infrastructure can take two to three sprints. Middleware’s auto-discovery agent detects every application and database running across your entire host fleet in minutes no manual inventory. Zero-code instrumentation lets you instrument selected services without touching your codebase, using a…
-
Bring Observability Directly Into Your IDE with Middleware MCP Server
Summary Every time an alert fires, most developers open four tabs before they write a single line of code. Middleware MCP Server eliminates that pattern by connecting AI-powered IDEs directly to your observability data via 21 structured tools that cover APM, logs, metrics, traces, dashboards, error tracking, and incidents. Investigation, triage, and root cause analysis…
