Tag: Observability
-
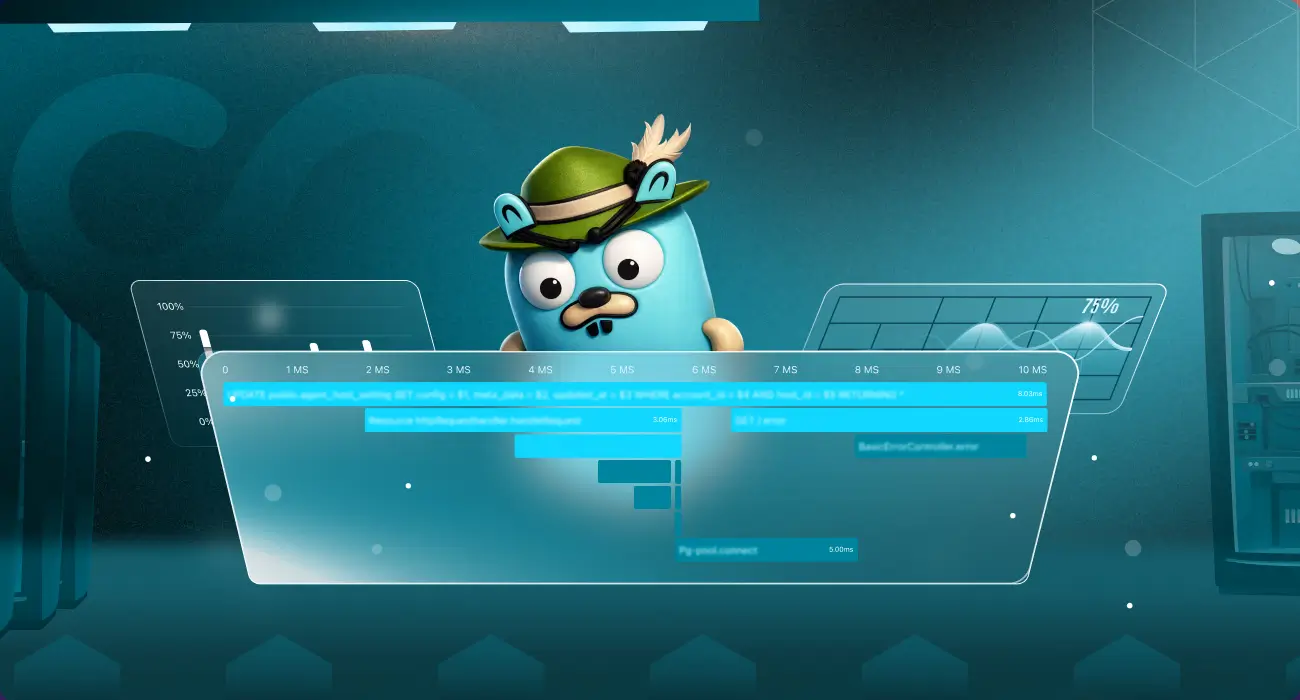
What Is Jaeger Tracing? A Beginner’s Guide to Distributed Tracing
Summary: Jaeger tracing is an open-source distributed tracing system that helps track requests as they move across multiple services. It collects trace data through OpenTelemetry, stores it in a supported backend, and provides a UI for searching and visualizing traces. Jaeger tracing helps engineers identify latency issues, service failures, and performance bottlenecks in distributed systems.…
-
Bring AI Inference Into Your Full-Stack Observability With the TrueFoundry AI Gateway Integration
Getting AI models into production is one challenge. Knowing what they do once they’re there is another. Every inference request carries information you need: latency, token usage, model behavior, finish reason. But wiring observability into each model and provider usually means repetitive, custom instrumentation for every integration. We built Middleware to remove that work. With…
-

New Relic vs Sentry: Full Comparison for 2026
New Relic and Sentry both monitor production software, but they solve different problems. New Relic covers apps, infrastructure, logs, browsers, mobile, Kubernetes, and synthetics on a single platform. It also includes APM and distributed tracing. Sentry started as an error tracker for developers and has since expanded to include APM, logs, and session replay, but…
-
How We Built an AI SRE Agent That Troubleshoots Production Issues Like a Team of Engineers
We built OpsAI because investigating a production incident has become one of the hardest cognitive tasks in software engineering, and the industry’s answer has been to add more dashboards. That’s the wrong answer. As distributed environments grow, the signals get noisier, failures span more systems, and Kubernetes adds layers that nobody fully understands at 3…
-
Logging vs Monitoring: What’s the Difference?
TL;DR: Logging records what happened inside your system. Monitoring watches whether your system is healthy right now. They answer different questions, and neither replaces the other. Logging and monitoring are two of the most commonly used terms in DevOps and engineering, often mentioned together, but they are not the same thing and do not do…
-
Kubernetes Infrastructure Monitoring: Complete Guide with Middleware
Kubernetes infrastructure monitoring tracks node CPU, memory, disk, and network health, as well as control plane and pod status, to surface problems before they affect users. Tools like Middleware provide pre-built dashboards and automated alerts that cut setup time from days to minutes. Table of Contents TL;DR Kubernetes infrastructure monitoring continuously tracks node CPU, memory,…
-
11 Best AI SRE Tools & Agents in 2026
AI SRE tools/agents are software systems that use large language models(LLMs) and observability data to detect anomalies, investigate root causes, and automate remediation during production incidents. SRE agents integrate with telemetry sources such as APM, logs, and infrastructure metrics to correlate signals across services. In practice, they automate work that SRE teams traditionally perform manually,…
-
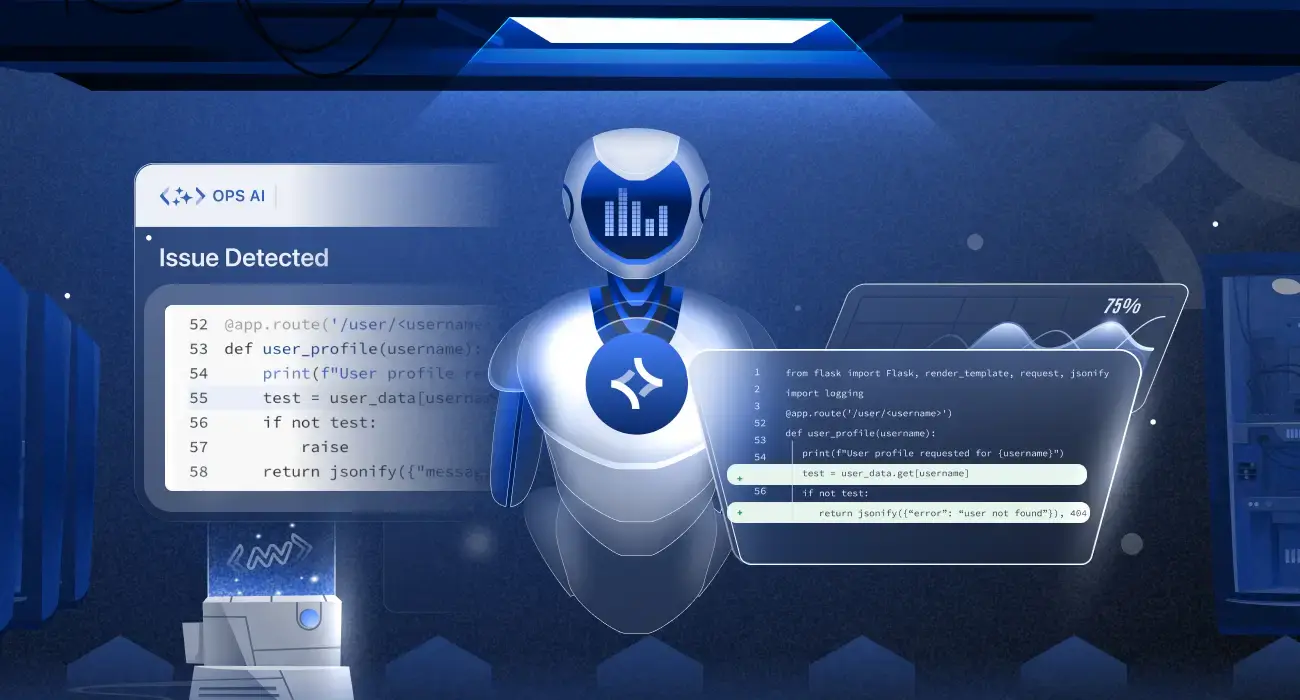
Introducing Middleware OpsAI: The AI SRE Agent That Resolves Production Issues Before They Reach Your Users
Summary: OpsAI is Middleware’s AI-native SRE agent that detects, diagnoses, and fixes production issues across APM, RUM, Logs, Kubernetes, and even third-party tools like Datadog and Grafana. Built on top of Middleware’s full-stack observability platform, OpsAI doesn’t just tell you something broke — it tells you why, where, and ships a pull request with the…
-
OpsAI vs Resolve AI: A Real-World Performance Comparison for SRE and Agentic Observability
Summary: We ran seven identical prompts through Middleware OpsAI and Resolve AI, covering use cases across Grafana, Datadog, APM, RUM, and Kubernetes. OpsAI won six out of seven rounds most often by a 6× to 10× margin and delivered actionable output like runbooks, kubectl commands, and ready-to-merge pull requests. Resolve AI performed well in isolated…
-
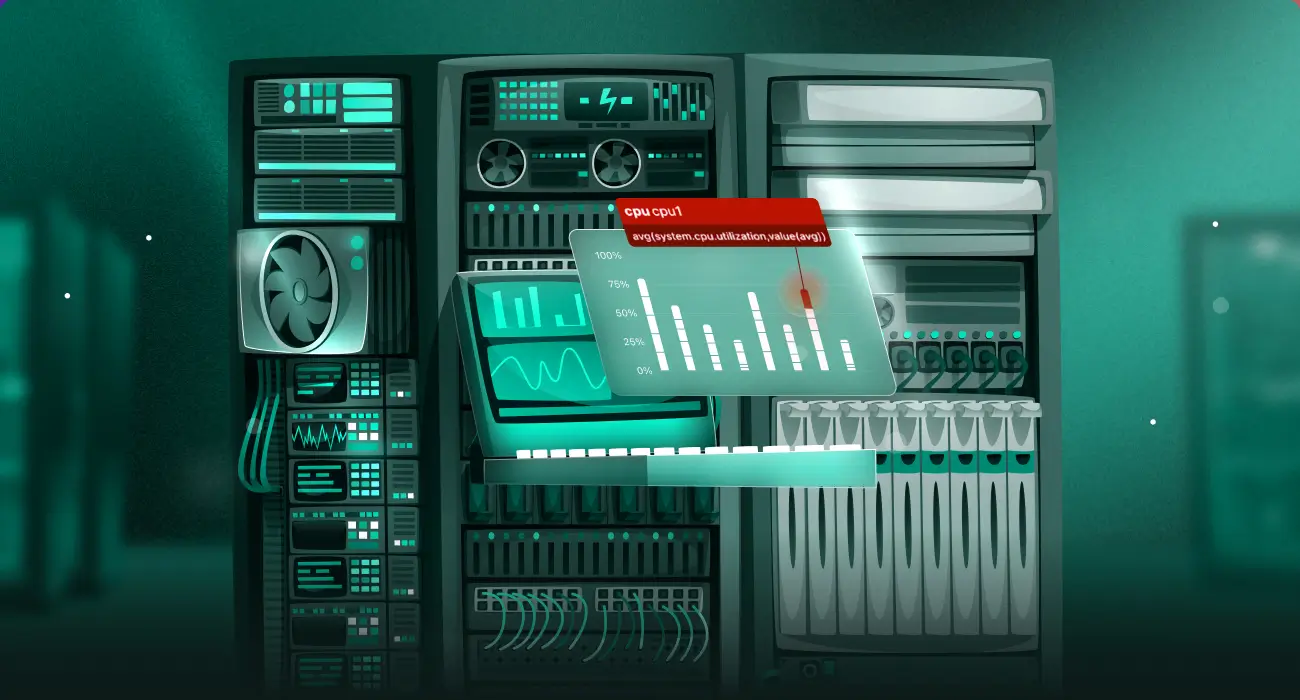
How to Monitor Virtual Machines with Middleware
Virtual machine (VM) monitoring tracks CPU, memory, disk, and network performance in real time, allowing infrastructure teams to detect and resolve issues before they affect users. 📖 New to infrastructure monitoring? Read our foundational guide → What Is Infrastructure Monitoring? This guide covers how to deploy Middleware’s OpenTelemetry-based monitoring across VMs on AWS, Azure, and…
-
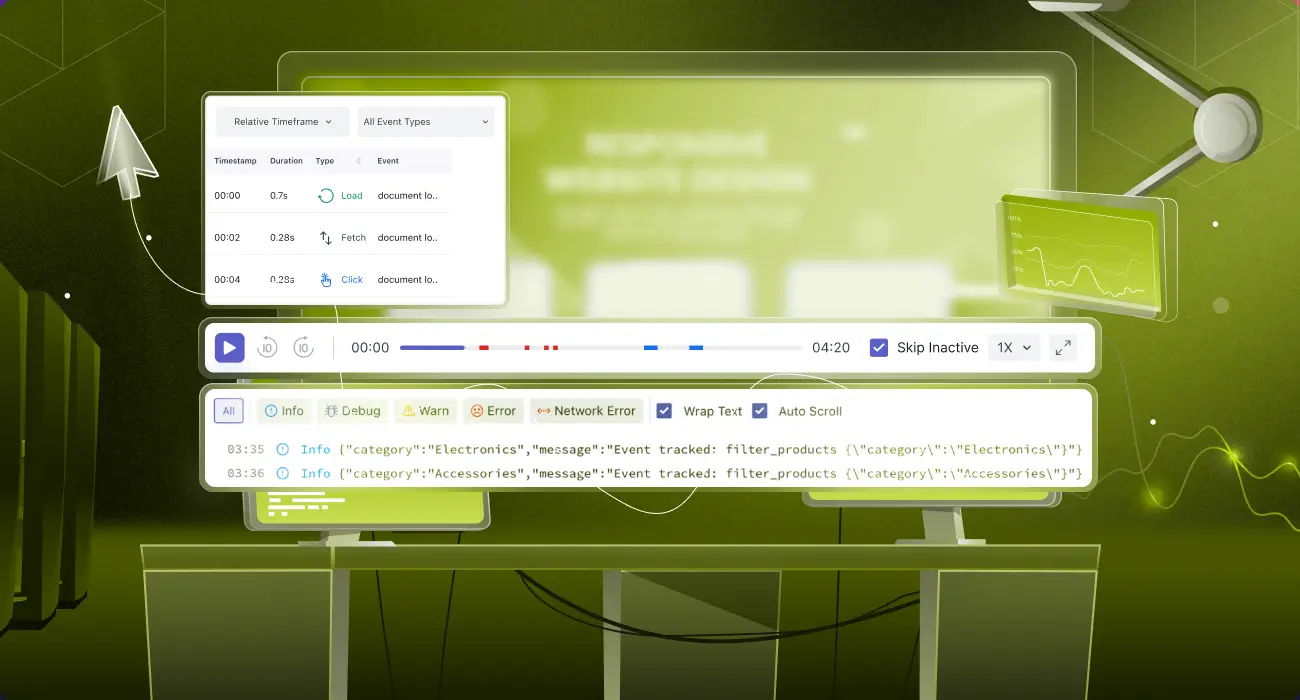
Frontend Performance Metrics: Bridging the Gap from Browser to Backend with RUM and Tracing
Frontend performance metrics measure how quickly and smoothly a web or mobile application behaves for users. This includes load time, interactivity, and visual stability across different devices, browsers, and app environments. Frontend performance metrics often show that something is wrong, but they fail to explain who is affected, how it impacts users, and where the…
-
How a SaaS Team Scaled End-to-End Browser Tests with Middleware Synthetic Monitoring
An EdTech platform with 200k users learned a hard lesson in reactive monitoring. After a Friday deployment, their status page was green, but their checkout was dead for iOS 14 users. It took two hours to diagnose while revenue leaked. By pivoting from manual regression to a Synthetic-First Observability Strategy with Middleware, they cut detection…
